Performance Evaluations—Are They Helping Us or Hurting Us?

Why are we conducting performance evaluations and how are they making the agency better? These are fundamental questions for agencies that require standardized performance evaluations. Without clearly answering these questions, supervisors are often put in the position of pursuing the “path of least resistance” when it comes to conducting performance evaluations. This path is understandably tempting for supervisors, but it often results in serious agency problems relating to legal liability in discipline and promotions—not to mention officer morale.

The “text book” answers to these aforementioned questions are straightforward:

Why are we conducting performance evaluations? We conduct these evaluations to ensure that supervisors give subordinates detailed feedback regarding their current performance, areas of needed improvement, and reasonable supervisor expectations.

How are they making the agency better? The agency is made better by this process as supervisors and subordinates are “on the same page,” expectations are clear and performance issues do not result from employees’ ignorance of expectations or ways to accomplish agency goals.

Unfortunately, for too many public safety agencies, the honest answers are: we do them because we are required to do them/we’ve always done them, and as far as making the agency better—your guess is as good as mine.

It would be bad enough if these evaluation systems simply failed to produce positive results in the form of detailed and documented feedback on performance strengths and weaknesses. Even worse, however, is the fact that broken performance evaluations actually damage agencies across the country by (1) giving inaccurately positive documentation to officers that is later used to reverse important disciplinary decisions in court or in arbitration and (2) giving standard “meets expectations” evaluations to officers whose performance merits much greater recognition.

Broken Performance Evaluation Systems—One of a Toxic Employee’s Best Friends

It is hardly a secret within public safety agencies that there are a small group of problem people who wreak havoc inside the agency and cause the lion’s share of stress and liability year after year. These individuals become much more difficult to deal with in an effective and legally defensible way when they are awarded “meets expectations” or even “exceeds expectations” with every performance evaluation.

Making difficult personnel decisions—from discipline to promotions to terminations—is essential for public safety leaders looking to meet their obligations to the communities that they serve. But when problem employees are given positive performance evaluations as standard operating procedure, personnel decisions become much more difficult to defend in court or in arbitration.

When agencies are arguing that a personnel decision was not arbitrary or discriminatory, their arguments are often contradicted by the agency’s own evaluations. Chiefs and sheriffs across the country are frequently placed in the painfully awkward position of asserting that the agency’s performance evaluations don’t mean what they purport to mean. The officer in question has been a problem for years and the court or arbitrator should not be swayed by performance evaluations that are incompatible with reality. Put more simply: inaccurate evaluations force agency leaders to argue against their own documentation.

Do Broken Performance Evaluation Systems Short Change High Performers?

Inaccurate performance evaluations in which supervisors are simply “circling down the middle” of the performance rating scale tend to underrate the hard work of many employees in the same way that they minimize the severity of problem behavior. This makes it much more difficult for agency leaders to discipline a high-level performer for an isolated mistake in a manner that is less severe than the discipline given to a problem employee who regularly engages in misconduct. Similarly, the promotional process is made more challenging when differences in past performances (one below standards and the other above) are not reflected in performance evaluations.

In seeking to promote or otherwise advance high-level performers, agency leaders should be aware of the problems posed by documentation that indicates that all agency employees are essentially the same. The overwhelming majority of the agency may recognize the difference between the high-level performers and the problem employees, but if it’s not in writing it didn’t happen. Even worse—the agency may be cementing a false narrative in the form of inaccurate performance evaluations that aren’t taken seriously throughout the agency. Often times, performance evaluations don’t seem to mean anything until they are part of a heated debate in costly litigation or arbitration.

To minimize the damage done by broken performance evaluation systems, agency leaders would be well-served to (1) decide if performance evaluations are a net positive for their agency in the first place, (2) create performance evaluation systems that are closely related to agency priorities, and (3) train all supervisors sufficiently on the practicalities of the evaluation system so that these evaluations reflect reality and are detailed enough to give employees notice of areas for improvement and the means of improving. If all of the agency supervisors are not on the same page when it comes to performance evaluations, it is nearly impossible to see how the pitfalls discussed here can be avoided.

Remember the People between the Dots

Criminologists have documented that as young law enforcement officers progress through their careers, there is a tendency to develop cynical views toward the general public. The public primarily calls the police when things have gone wrong and, therefore, officers are overexposed to negative events and to bad citizen behavior. As a result, officers can often begin to lump all citizens together and view them all in a negative manner that reflects their experiences with those in the community prone to criminality, dishonesty and violence.1

Intelligence-led policing strategies may have also exacerbated this phenomenon as an unanticipated side effect of these policing strategies. Intelligence-led policing, sometimes referred to as “putting cops on dots,” emphasizes proactively deploying law enforcement officers to high crime locations at peak times for criminal offending. The aim of this strategy is deterring crime before it occurs. It is indisputable that intelligence-led policing strategies have been very successful at reducing actual crime.2 One negative side effect, however, is that since officers are deployed directly to locations where criminal offenders operate at times when these offenders are most likely to engage in crime, officers increase their exposure to the bad guys. Additionally, the fact that crime hot spots tend to be clustered nearby each other in specific neighborhoods makes it very easy for officers to stereotype everyone found in the area as a criminal.

This phenomenon can be reversed, however, if officers take proactive steps to familiarize themselves with the law-abiding citizens that frequently live in between these hot spot locations. Between these hot spot dots live many law-abiding people who suffer the effects of the crimes occurring nearby. These unfortunate people live in fear of the criminal element within their neighborhood, frequently become victims of crime and disorder, and are sometimes subjected to police stops and searches because officers have difficulty differentiating between the criminal and the law-abiding residents of the neighborhood.

They Are There

Some extremely cynical officers may argue that there are very few law-abiding people living within the most high-crime neighborhoods, especially on blocks with multiple crime hot spots. The evidence, however, suggests otherwise. Consider, for example, Beat 1011 in Chicago. This small patrol beat is composed of about 50 blocks, is less than a square half mile in area, and is estimated to have a population of around 6,000 residents. According to the Chicago Sun Times, Beat 1011 has the highest violent crime rate in Chicago for the first half of 2017.3 According to statistics from the Chicago Police Department, 1,815 criminal offenses were reported within this beat during 2016, and 4,537 calls for police services were generated from this beat. In the first six months of 2017, gunfire in Beat 1011 produced 10 murders and 19 non-fatal gunshot victims. This is an example of a neighborhood experiencing some of the most extreme amounts of crime imaginable, and it would be easy to think that everyone in this beat is a criminal – but that would be incorrect.

The photo below is a Google Earth image of the largest portion of Beat 1011. Superimposed over this photo are red dots that indicate the addresses of all of the crimes reported to the police in this area for a period of two-and-a-half years. At first glance the seriousness of the crime problem is obvious, but a closer examination reveals that the crime is concentrated at specific addresses – hot spots. There are numerous homes visible that have not been the scene of a crime of any sort over the last three years, despite the high level of overall neighborhood crime.

Crime Report Map

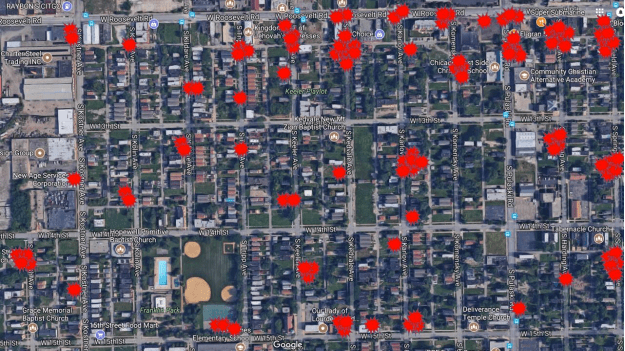
While almost every block has at least one crime hot spot, there are many, many homes and apartments between the dots where no crimes have been reported. Even at the red dot locations, there are still law-abiding people. One example is an incident that occurred within this beat in 2016 when a 59-year-old woman, flanked by her 25-year-old daughter and 19-year-old nephew, attempted to get a group of gang members to leave her porch. Gunfire erupted, the woman’s windows were shot out, and she was wounded after being hit in the head by a bullet.4 Not in a financial position to be able to sell her home and buy a new one, she must remain living amidst this neighborhood. She wishes someone would help make her block safer.

Another example of the level of law-abiding people within these neighborhoods comes from a study presented this year at an economics conference at the University of Chicago. This interesting study involved intentionally making a delivery error of a letter to 180 impoverished addresses and 180 wealthy addresses in one large city, to see who was more likely to return the letter to the post office. The letter was made to look like it had been mailed to a young man by his grandfather and contained either $15 or $60 in cash, or a gift card. The note and the envelope were thin enough that one could see there was cash or a credit card-like object inside when held up to the light.5

The letter, addressed to someone else, was intentionally delivered to 180 residential addresses in a neighborhood with a median household income of $25,000, and another 180 addresses in a neighborhood with a median household income of $2.5 million. To give perspective on these two neighborhoods, the median household income of the entire city was about $52,000 and the median home value was about $300,000. While the researchers did not report the crime statistics of these two neighborhoods, one can easily assume that the poor neighborhood (at less than half the city average household income) experienced significantly more crime, especially when compared to the neighborhood of millionaires.6

The researchers found that 80% of the letters delivered in the rich neighborhood were returned to the post office or forwarded to the rightful addressee. Approximately 40% of the letters in the poor neighborhood were returned to the rightful addressee. While this is far below the rate for the wealthy neighborhood, its significance should not be overlooked. Four out of every ten people in this very poor neighborhood, people who could desperately use an additional $15 or $60, did the right thing and returned the letter to the correct addressee.7

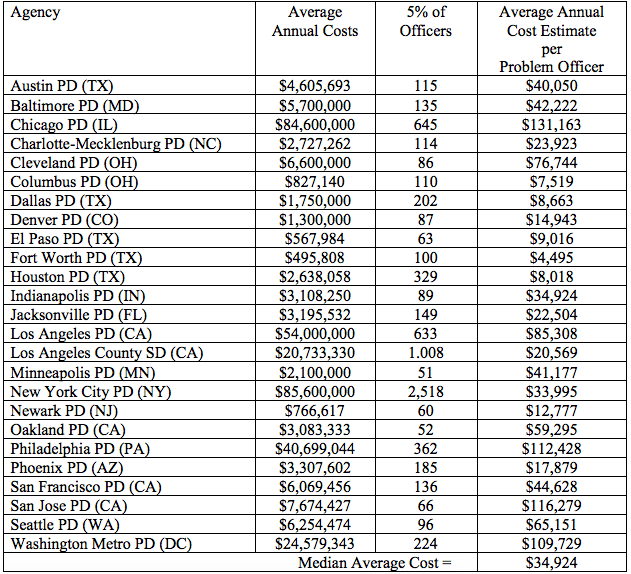
Over the last half century, criminologists have demonstrated that the overwhelming majority of crimes and calls for police services (about 80%) occur at a very small proportion of addresses (about 5%).8 Further research has revealed that the primary thing that makes these hot spot locations concentrations for crime and disorder is that they are commonly frequented by the small number of individuals that generate the vast majority of crime.9 One study in Toledo, Ohio revealed that 347 individuals (0.1% of the city’s population) accounted for all robbery, aggravated assault, and burglary arrests in the city over a three-year period. Additionally, only 1.5% of all Toledo residents were cited or arrested for any traffic or criminal offense over a three-year period, suggesting that 98.5% of the city’s population routinely avoids police enforcement contacts.10 Research indicates that the criminal element in any community is relatively small, but very active, making it appear as though a whole neighborhood is crime infested.

Reaching the People between the Dots

Even in Chicago’s Beat 1011 there is time between calls and enforcement action to reach out and get to know the law-abiding folks that live between the dots. Beat 1011 had 4,537 calls for service in 2016, which is 12.4 calls for service per day, or about one call every other hour. This means that even in this highest of crime beats there is still time to spend 30 minutes or so every shift getting to know a law-abiding citizen or two on that beat.

Ten studies have found that proactive, non-enforcement, contacts with average citizens reduces fear of crime and increases public satisfaction with the police.11 These contacts are not public relations fluff, but rather real police work activities focused on maintaining order, detecting crime, and making citizens feel safe.12 In Houston, for example, police targeted a couple of high crime blocks and required patrol officers to stop twice during their shift to meet residents at their homes, or business people at their stores or offices. During these brief contacts (usually less than 10 minutes), the officer introduced him or herself, said the purpose of the visit was simply to get acquainted and learn whether there were any problems in the area the citizen felt the police should know about. The officer then left a business card. Neighborhood citizen satisfaction surveys that were conducted before and after officers were ordered to make these contacts revealed that fear of crime fell substantially in the neighborhoods targeted, and citizen satisfaction with the police rose.13

The Portland Bureau of Police in Oregon has mated this strategy with its intelligence-led policing efforts. The computer-aided dispatch system assigns officers to conduct these non-enforcement contacts at specific crime hot spot locations at specific hot crime times. If officers see illegal activity while at the hot spot, they take appropriate legal action. If they do not see illegal activity, they use that time to talk with people in the area and get to know them better.

Additionally, researchers in one large city surveyed 977 residents of public housing apartments. The survey contained questions about a variety of different city services, but included questions about fear of crime, satisfaction with the police. These residents were surveyed about how often they saw police cars, foot patrols, or had informal face-to-face contact with police officers. The residents who reported having had informal face-to-face contact with the police in the last six months had the lowest fear of crime and the highest satisfaction with the police.14

Regardless of the picture the mainstream media tries to portray, the evidence strongly indicates that most of the people living between the dots want help and appreciate police protection. They do not appreciate being stopped and treated like a suspect because of where they live, but they want the police to address the crime on their block. They live in fear and need your help, but most do not know you by name, and it is likely you do not know them either. Maybe it is time to have some out-of-car experiences and get to know the people living between the dots.


References

1 Brown, M. K. (1988). Working the Street: Police Discretion and the Dilemmas of Reform. Thousand Oaks, CA: Sage; Crank, J. (2004). Understanding Police Culture. Cincinnati, OH: Anderson; Gilmartin, K. M. (2002). Emotional Survival for Law Enforcement. Phoenix, AZ: E-S Printing.

2 Boba-Santos, R. (2012). Crime Analysis with Crime Mapping. Thousand Oaks, CA: Sage; Ratcliffe, J. H. (2008). Intelligence-Led Policing. New York, NY: Wilan.

3 Charles, C. & Rezin, A. (2017, July 22). Cops targeted Chicago’s most violent beat, so crime moved next door. Chicago Sun Times. Located at: http://chicago.suntimes.com/news/copstargeted-chicagos-most-violent-beat-so-crime-moved-next-door/

4 Ibid.

5 Andreoni, J., Nikiforakis, N., & Stoop, J. (2017). Are the rich more selfish than the poor, or do they just have more money? A natural field experiment. Working Paper 23229. National Bureau of Economic Research.

6 Ibid.

7 Ibid.

8 Brantingham, P., & Brantingham, P. (1999). Theoretical model of crime hot spot generation. Studies on Crime and Crime Prevention, 8, 7–26; Patten, I. T., Mckenlden-Coner, J. M., & Cox, D. (2009). A microspatial analysis of robbery: Prospective hot spotting in a small city. Crime Mapping, 1(1), 7-32; Sherman, L. W., Gartin, P. R., & Buerger, M. E. (1989). Hot spots of predatory crime: routine activities and the criminology of place. Criminology, 27(1), 27-56.

9 Farrell, G. (2010). Situational crime prevention and its discontents: Rational choice and harm reduction versus ‘cultural criminology.’ Social Policy and Administration, 44(1), 40-66; Farrell, G., Clark, K., Ellingworth, D., & Pease, K. (2005). Of targets and supertargets: A routine activity theory of high crime areas. Internet Journal of Criminology, 2005, 1-25; Sherman, Gartin, & Buerger (1989).

10 Author’s unpublished research as part of a U.S. BJA Smart Policing Initiative grant with the Toledo Police Department.

11 Zhao, J., Scheider, M., & Thurman, Q. (2002). The effect of police presence on public fear reduction and satisfaction: a review of the literature. The Justice Professional, 15(3), 273- 299.

12 Ibid.

13 Brown, L., & Wycoff, M. A. (1987). Policing Houston: reducing fear and improving service. Crime and Delinquency, 33(1), 71-89.

14 Salmi, S., Gronroos, M., & Kreskinen, E. (2004). The role of police visibility in fear of crime. Policing: An International Journal of Police Strategies and Management, 27(4), 573-591.

Estimating the Cost of a Problem Officer

Law enforcement is a high-liability profession. Lawsuits against law enforcement officers and agencies absorb an inordinate amount of personnel time and agency resources. Officers and supervisors have to be interviewed or deposed, attorney fees have to be paid, documents have to be gathered and copied, meetings are held with city officials, and insurance companies must be consulted. It all results in one expensive, time-consuming mess.

Some lawsuits against law enforcement agencies and officers are baseless, but others are not. In fact, several studies have revealed that the vast majority of citizen complaints and lawsuits filed against any law enforcement agency are generated by a small number of repeat offender personnel. One study examined citizen complaints across 165 law enforcement agencies in the state of Washington, finding that about 5% of the officers on these agencies were responsible for all of the sustained citizen complaints.1 Another study examined 15-years of citizen complaint and internal misconduct data within one urban police department in the state of New York. It found that about 6% of the officers employed by the department over those 15 years accounted for almost all of the internal and external allegations of misconduct.2

A third study examined more than 5,500 citizen complaints against officers on eight police departments from mid-sized cities. This study found that only around 5% of the officers had received more than one sustained citizen complaint, with this small group of officers accounting for more than 100 excessive force allegations, 200+ discourtesy allegations, and numerous other misconduct complaints.3 All of these studies found that while some officers receive only one sustained complaint or lawsuit during their careers, the vast majority of these problem officers accumulated 3 or more sustained citizen complaints.

These are problem-prone officers, often referred to as “bad apples,” and they create havoc within their respective government agencies. They routinely damage relations with the public, bring discredit to their agencies, and place their peers at risk for danger and lawsuits. Most of us have experienced them, and their effects, at some point within our agencies. In fact, one study involving interviews with officers from 11 police departments in Arizona revealed that most officers know who the problem officers are and resent that they often remain employed by their agencies.4 In this modern age of technology-driven transparency, the antics of these repeat problem-prone officers are also increasingly on display for the world to see—with the liability and public trust costs that come with them.

Removing Problem Officers

Removing bad apples has clear benefits for the well-being of the community, the reputation of the agency, and the morale of the department. The simplest way to deal with these problem officers is to avoid hiring them in the first place, yet many law enforcement agencies do not devote sufficient time or importance to background checks and the hiring process. Often agencies blame this lack of effort on the financial cost involved in a thorough background check, or political pressure to hire officers quickly or hire members of traditionally underrepresented groups.

After a conditional offer of employment is extended to the individual, the academy training period, field training, and probationary period continue to offer opportunities for agencies to terminate officers exhibiting problematic behaviors. Unfortunately, far too many agencies continue to try to counsel and reform these recruits or probationary officers, based on the argument that so much money has already been invested in the recruiting, hiring, and training of the individual.

Once the problematic officer successfully makes it off probation and achieves the civil service and / or union protection given to full-fledged officers, administrative and legal protections increase the difficulty of terminating such an officer. While it becomes harder to dismiss a problem officer who successfully got off probation, it is not impossible. Nevertheless, many law enforcement and government leaders worry that trying to get rid of such a problem officer is far too costly in terms of legal fees associated with the termination and the inevitable officer lawsuit.

Note that most of these concerns that prevent the effective removal of problem-prone officers tend to revolve around financial costs. Background checks are too costly. Waiting to hire the right people is too costly. Terminating a recruit or probationary officer in which thousands of dollars have already been invested is too costly. Terminating a problem-prone full officer, and defending against the resulting lawsuit, is too costly. However, has anyone ever sat down and done the math to examine these costs and compare it to the cost of the alternative? What is the financial cost of having a problem-prone officer on your department?

Estimating the Civil Liability Costs of the Problem Officer

To estimate the average annual civil liability cost of a single problem-prone officer in a law enforcement agency, data from several sources were used. A search of a number of online newspapers was conducted to locate articles that reported annual payouts to citizens by cities for lawsuits over police misconduct allegations. Articles published since 2010 reported multiple years’ worth of data about civil court payouts, specifically for police misconduct in 25 agencies from 15 states. Only jurisdictions for which multiple years’ worth of data were used as any given municipality could have a single abnormally large settlement in a single year. It is important to note that these payouts were only for lawsuits from citizens, and not internal officer lawsuits. These payout costs also only accounted for money paid to the plaintiff, and do not include other costs incurred by the jurisdiction such as litigation expenses and insurance fees.

Federal government data from the 2015 Census of State and Local Governments was accessed to determine the total number of full and part-time officers of each of these law enforcement agencies. Based on the prior research suggesting that about 5% of officers account for the vast majority of misconduct complaints and lawsuits, this percentage was used to estimate the number of problem officers with which each department might be struggling. The average annual payout by the agency was then divided by the estimated number of problem-prone officers to estimate the average annual payout for each jurisdiction-per-problem-officer. The results are displayed in the table below.

The average annual cost estimate per problem officer ranged from a low of $4,495 for Fort Worth, to a high of $131,163 for Chicago. Since jurisdictions can vary dramatically in their payouts due to differing attitudes of each local court, and differences in the egregiousness of officer misconduct, it is best to consider the average cost of the whole sample using the median cost. The average median cost in this sample was $34,924 per problem officer per year. If such an officer serves a 25-year career, the law enforcement agency can expect to pay about $873,100 in compensation to citizens suing the department. Again, it is important to note that these figures do not even include costs for legal defense, insurance rates, or internal lawsuits over officer grievances filed because of this officer, so it is reasonable to expect to pay about twice as much for this officer’s misbehavior when all expenses are considered.

Is It Worth It?

Some law enforcement and government leaders cite financial costs as a barrier to properly investigating applicants, terminating poorly performing trainees, and dismissing serious misconduct officers. In these cases, it is important to weigh these decisions against the estimate developed here. If your jurisdiction does not expend a few extra thousand dollars on thorough background checks of job applicants, then you very well could end up paying an addition $35,000+ every year in civil case payouts if you end up hiring a problem-prone officer. Likewise, jurisdictions will save money if they terminate a problem-prone officer for cause and end up paying less than $35,000 a year in legal costs to win any arbitration or wrongful termination hearings. The reality is that the legal fees associated with defending accusations of wrongful termination from one former officer are generally much less than $35,000 per year if you win.

Even if you lose, one study in Florida found that the average payout for a wrongful termination lawsuit in that state was only $40,000.5 Which would you rather do? Would you rather pay $40,000 plus a few thousand dollars in litigation fees to rid your agency of a serious problem-prone officer, or continue to pay $35,000 in payouts to citizens plus legal and insurance fees each year for many years into the future? Biting the cost bullet now to prevent continued future loses later is often the right decision. Agency funds well spent now to ensure problem-prone officers are removed or not hired can reap significant financial savings for the agency later.


References

1 Dugan, J. R., & Breda, D. R. (1991). Complaints about police officers: A comparison among types and agencies. Journal of Criminal Justice, 19, 165–171.
2 Harris, C. J. (2010). Pathways of Misconduct. Durham, NC: Carolina Academic Press.
3 Terrill, W., & Ingram, J. R. (2016). Citizen complaints against the police: an eight city examination. Police Quarterly, 19, 150-179. 
4 Haarr, R. N. (1997). They’re making a bad name for the department: Exploring the link between organizational commitment and police occupational deviance in a police patrol bureau. Policing: An International Journal of Police Strategies & Management, 20(4), 786-812.
5 Cutting Edge Recruiting Solutions (2012). Officer Lawsuits. Boca Raton, FL: CERS.

Community Policing is Not Soft on Crime: The Evidence

Dolan Consulting Group is committed to the principles of community-oriented policing. Unfortunately, we sometimes encounter push back from attendees in our courses that suggest community-oriented policing strategies are some form of a “hug-a-thug” philosophy that is soft on crime and criminals. We are often baffled when we encounter such views as we struggle to understand how community-oriented policing strategies, designed to include law abiding citizen input to determine crime priorities and responses, could be considered soft on crime.

The community-oriented policing strategies we advocate focus on the targeting of crime and criminals. These strategies involve officers getting out of their patrol cars and actively engaging the community in a way that builds relationships that lead to intelligence-gathering and crime prevention and prosecution. Including citizens in the processes of alerting the police about crime and identifying criminals is designed to lead to the successful prevention and prosecution of criminals preying upon communities.

Dr. Robert Trojanowicz, one of the founders of modern community-oriented policing, defined it this way:

Community Policing is a philosophy of policing, based on the concept that police officers and private citizens working together in creative ways can help solve contemporary community problems related to crime, fear of crime, social and physical disorder, and neighborhood decay. The philosophy is predicated on the belief that achieving these goals requires that police departments develop a new relationship with the law-abiding people in the community, allowing them a greater voice in setting local priorities, and involving them in efforts to improve the overall quality of life in their neighborhoods. It shifts the focus of police work from handling random calls to solving problems.1

How is that soft on crime? A careful examination of American policing prior to the 1950s will reveal that this “community policing” is what regular policing was like in both rural and urban environments for decades. And yet it is hard to imagine, for all the imperfections of policing in the early 20th Century, criticizing police officers of that era as being soft on crime.

A research study has just been published that provides strong evidence that community policing is not soft on crime but actually leads to higher arrest rates for violent crimes. In May of this year, the research journal Justice Quarterly published a study by Dr. Rob Tillyer of the University of Texas at San Antonio. This study examined violent crime arrest rates across a nationwide sample of 603 law enforcement agencies.2 Professor Tillyer specifically looked at 402,786 reports of violent crimes across these 603 jurisdictions to determine the percentage of these cases that were cleared by an arrest. He examined whether or not agencies engaged in community-oriented policing had lower arrest rates.

Professor Tillyer measured each agency’s level of community-oriented policing (COP) activity as the total number of community policing tactics / policies the agency employed. These tactics / policies included COP as part of the agency’s mission statement, a formal COP unit, use of the SARA problem solving process by patrol officers, a written COP plan, development of formal partnerships with the community, conducted community surveys, and used of technology in the COP process. Some agencies in the study had none of these COP tactics / policies, and a few engaged in all of them. The average agency employed between two and three of these policies / tactics.3

After accounting for the influences of situational characteristics (i.e., crime type, victim characteristics, witnesses present, etc.), and organizational characteristics (i.e., agency size, crime rate, call for service workload, etc.), the study revealed that agencies that engage in community-oriented policing had slightly higher overall arrest rates than did agencies that engaged in none of the stated COP activities. In fact, the more COP tactics / policies an agency had, the higher its overall arrest rate for violent crimes. Each additional COP tactic or policy increased the agency’s arrest rate, but the greatest arrest rate increases—the biggest bang for the buck—resulted from having COP as part of the agency mission statement, and having formal partnerships with the community.4

This wide-reaching, rigorous study is just one more piece of research evidence supporting the importance of community-oriented policing. In earlier research briefs we have cited research articles that analyzed numerous published studies of community-oriented policing strategies. These studies revealed overwhelming evidence that some community policing tactics (neighborhood substations, general community meetings, problem-solving community meetings, foot patrols, and intentional informal face-to-face police-citizen contacts) consistently reduce fear of crime and increase confidence / satisfaction with the police.5

All these tactics share one thing in common: face-to-face contact between law enforcement officers and law-abiding citizens within neighborhoods of greatest need. This can be achieved through the daily and intentional of out-of-car experiences with law-abiding citizens by all in law enforcement. The available evidence demonstrates that community-oriented policing can clearly bridge the gap between the police and law-abiding citizens while still holding offenders accountable for criminal activity.

In fact, the available evidence shows that community-oriented policing is tough on crime— leading to more arrests as officers increase their “out of car experiences” to build relationships, gather intelligence and successfully apprehend the criminals preying upon the community.


References

1 Trojanowicz, R., & Bucqueroux, B. (1990). Community Policing: A Contemporary Perspective. Cincinnati, OH: Anderson Press, Page 5.

2 Tillyer, R. (2017). Assessing the impact of community-oriented policing on arrest. Justice Quarterly. Volume and issue forthcoming. This article can be downloaded at: http://www.tandfonline.com/doi/full/10.1080/07418825.2017.1327609

3 Ibid.

4 Ibid.

5 Weisburd, D., & Eck, J. E. (2004). What can police do to reduce crime, disorder, and fear? Annals of the American Academy of Political and Social Science, 593(1), 42-64; Zhao, J. S., Schneider, M., & Thurman, Q. (2002). The effect of police presence on public fear reduction and satisfaction: a review of the literature. The Justice Professional, 15(3), 273-299.