Protecting Children– Best Child Safety Practices for Places of Worship

A place of worship should be the safest place on Earth for children. Unfortunately, far too frequently we see news stories about children victimized within a church or other religious setting. When children are harmed through abuse, they often carry psychological scars that they will struggle with throughout their entire lives. They question what about themselves made someone want to harm them, and they question why no one protected them. This can have a tremendous negative impact on their feelings of self-worth, their ability to form close bonds with others, and feelings of safety.[1] And children who suffer abuse by a spiritual leader often live their lives with a damaged relationship to God, their spirituality and the church structure within which they were victimized.

Recent research into child abuse scandals within churches has revealed that, in most incidences of, a number of procedural safeguards were missing. Instituting these practical safeguards within your place of worship can significantly reduce the likelihood of future incidents involving abuse of children.[2] Parents attending your place of worship are entrusting you with the safety and care of their children. It is your responsibility to live up to that trust and do what is best to keep these children safe. This article will discuss the six best practices to protect children in churches, synagogues, temples and mosques.

The Dangers Posed to Children

Because of media attention on these acts, most people focus in on the danger of sexual predators when considering child safety. To be sure, it is possible that a sexual predator—a wolf in sheep’s clothing—may volunteer within this environment in order to get access to victims. There are, however, many other potential dangers in a children’s ministry environment as well. Children’s ministries tend to be heavily reliant on volunteers. Some volunteers may lack good parenting skills, and bring these poor parenting skills into the children’s ministry environment. There are also sometimes parents who are so stressed out from caring for their own children all week that they have little patience left at the end of the week to care for a room full of crying toddlers. Such situations may lead to abuse or a child being harmed because he or she was not watched properly.

Children’s ministries are also at risk of dangers posed from outside of the children’s ministry environment. Child abduction from outsiders or non-custodial parents is one threat. There are dangers posed by emergencies such as fires, tornadoes, flash flooding, or earthquakes. Finally, violent crime, in the form of an active shooter within the building or a violent crime committed nearby within the neighborhood, can also place children at risk. Places of worship need to take action to reduce the likelihood of the dangers posed to children by these situations.       

  1. Screen Staff and Volunteers

Your church should run official criminal records checks on everyone who works on staff, volunteers, or directly interacts with the kids in your children’s ministry. Religious institutions promote the idea of redemption and make room for people with criminal arrest records to serve and participate in the community. Children’s ministry should not be one of those areas. Persons who have engaged in violent or sex-related crimes should not be placed into a position of temptation overseeing children.[3] While this might seem counter-intuitive to the message of redemption, these steps are necessary for protecting children in church and other worship settings as well as removing a potential “stumbling block” from those recovering from criminal pasts.

Staff and volunteers should also be vetted beyond a simple criminal records check. Many churches require the volunteer to provide three personal references, and answer questions about issues related to their current or past pornography viewing, or any problems they have had with anger management. Your organization may also consider providing the volunteer with scenarios of difficult situations that might occur within the children’s ministry area and ask the applicant how he or she would handle the situation.[4] You need to ensure that those serving within the children’s ministry have the proper skills to serve well in that capacity.

  1. Secure the Physical Area

It is important that the children’s ministry area is protected from unauthorized access by those not serving in children’s ministry, and that the children being cared for cannot wander off. This requires the children’s ministry area to be secured.[5] Depending on the size of your church or children’s ministry, you may need to secure a single room or an entire wing of the facility. Regardless, children should not leave the area without an adult escort unless they have been turned back over to the care of their parent or guardian. Persons not serving within the children’s ministry, or picking up or dropping off a child, should not be allowed within that area of the building. The volunteers and staff should also be able to secure the area, such as locking the doors, if a dangerous situation—such as an active shooter—occurs.

  1. Establish a Check-in/Checkout Procedure

This is an important practice for churches of all sizes, but especially those large enough that those working in the children’s ministry do not know all of the children’s parents by sight. It is uncomfortable to think that someone would try to take a child, but the reality is that there are some evil individuals within society who want to kidnap children.[6] What occurs much more often, however, is a bitter child custody dispute situation. In such situations, the noncustodial parent attempts to collect the child while the custodial parent is attending the worship service. The child may happily recognize the noncustodial parent, thus fooling the volunteer or staff member into thinking that everything is normal. Such custody dispute issues arise out of divorces, but also, because of the current opioid epidemic, when grandparents have to take custody of grandchildren from their own drug addicted children.[7]

A common check-in and checkout security procedure involves printing matching identification tags containing random number or letter combinations using sticky label sheets and a computer. Print them in pairs; put one on the child’s shirt back and give one to the parent. You could also include the names and contact number on the stickers in case a parent needs to be contacted to come get a child during the worship service. The matching sticker system allows adults to prove their child belongs with them. The sticker system also allows another authorized adult to pick up the child for the parent. For example, the parent may drop off the child, but then pass the matching sticker to a grandparent so that the grandparent can retrieve the child. It is important to enforce this matching tag system equally. Even when you are familiar with the family involved, treating everyone equally prevents others from feeling singled out as outsiders.

  1. Train All Staff and Volunteers

Ensure that all staff and volunteers working within the children’s ministry area have been properly trained about all procedures regarding the children’s ministry.[8] People’s schedules during the week can be hectic, so it might be best to create a training video and/or PowerPoint presentation for the volunteers to review as their schedules permit. It is also wise to create a brief test—such as ten true-false/multiple-choice questions—to ensure the volunteers actually paid attention to the training provided.     

Teach your volunteers about your procedures, the purposes behind these procedures and how they keep children safe. This training should emphasize keeping the children’s ministry area secure, enforcing the check in and out rules, handling toileting issues safely, and knowing the expected responses when emergencies or natural disasters occur. Whenever possible, volunteers should be provided basic first-aid training as well, especially CPR and how to respond to a choking child.

  1. Have Clear Plans and Procedures

Training about your children’s ministry policies cannot happen, however, if no such policies exist. Child safety, and church legal liability, depend upon having and following clear policies and procedures. For example, a clear toileting protocol must be established to avoid potentially compromising situations and help volunteers avoid confusion uncomfortable circumstances. The policy should require at least two volunteers participate in taking potty-trained children to the restroom, and volunteers should encourage the children to do as much for themselves as they are capable, such as undressing, wiping, and flushing. Your policies should also require two volunteer or staff workers assigned to each room of children. An adult should never be left alone with children. Every children’s ministry room should be equipped with a first-aid kit, fire extinguishers, and disinfectant. Emergency exit plans should be posted and volunteers should have access to a phone. Your written policies should clearly spell out what volunteers are to do in case of any type of emergency.

  1. Be Watchful

Establishing policies and procedures is not helpful if volunteers do not follow them. Staff and volunteers should keep an eye on fellow children’s ministry workers. Foster a team mentality and help one another member to follow the rules.[9] Watch for any suspicious behaviors and challenge any suspicious persons. Try to have a volunteer or two to go room-to-room and check on volunteers, find a parent when needed, or assist room volunteers who cannot leave their assigned children with only one adult. Finally, listen to what the children tell you. A child might be experiencing abuse at home, and you might be the only one he or she feels safe enough to report it.

Be aware that if abuse is observed or reported to you, it cannot be ignored. Most states classify anyone who works with children, including church volunteers and clergy, as “mandated reporters.” Mandated reporters are legally required to report any suspected child abuse to law enforcement or family services. If abuse was reported and no action taken to inform the authorities, legal action (such as a lawsuit or even criminal prosecution in many states) could result. Every place of worship that includes children should have a formal policy for reporting suspected child abuse to the appropriate authorities.[10]

Conclusion

Children’s ministries serve many important roles and demonstrate there is at least one place in this world where they are loved, appreciated and safe. They allow children to develop healthy friendships with other kids. They also free up parents to be engaged in church activities and serve. The children’s ministry is an extremely important part of a healthy and growing congregation. Places of worship should take every reasonable step to fulfill these roles in the safest manner possible. While many of the suggestions described here may put a strain on the numbers of staff and volunteers needed to fulfill these recommendations (i.e., scrupulous vetting of volunteers, training all volunteers, etc.), the inconvenience is worth it if it spares even one child from an accident or abuse, or protects the church from even one allegation of misconduct.


References  

[1] Lalor, K., & McElvaney, R. (2010). Child sexual abuse, links to later sexual exploitation / high-risk sexual behavior, and prevention / treatment programs. Trauma, Violence, and Abuse, 11(4), 159-177.

[2] Eisen, E. (2018). Situational factors related to childhood sexual abuse in the Orthodox Jewish community among adult and juvenile offenders. Journal of Child Sexual Abuse, 27(5), 537-553; Oliver, B. E. (2007). Preventing female-perpetrated sexual abuse. Trauma, Violence, & Abuse, 8(1), 19-32; Terry, K. J., & Ackerman, A. (2008). Child sexual abuse in the Catholic Church: How situational crime prevention strategies can help create safe environments. Criminal Justice & Behavior, 35(5), 643-657;

[3] Abel, G. G., Jordan, A., Harlow, N., & Hsu, Y. S. (2019). Preventing child sexual abuse: Screening for hidden child molesters seeking jobs in organizations that care for children. Sexual Abuse, XX(X), XXX-XXX.

[4] Ibid.

[5] Terry & Ackerman (2008).

[6] Ibid.

[7] Griffin, T., Miller, M. K., Hoppe, J., Rebideaux, A., & Hammack, R. (2007). A preliminary examination of Amber Alert’s effects. Criminal Justice Policy Review, 18(4), 378-394.

[8] Terry & Ackerman (2008).

[9] Ibid.

[10] Woika, S. & Bowersox, C. (2013). Child abuse and mandated reporting. Educational Horizons, 91(4), 26-29.

Reducing Vandalism at Places of Worship

Surveys of church leaders have revealed that more than 70% have experienced at least one act of vandalism to their church within the last year. More than 60% of these acts of vandalism have included graffiti.[i] Though often minor in the amount of actual danger posed, these acts blemish the appearance of the building, break the hearts of those who worship there, frustrate church staff, cause additional financial expenses, and contribute to rising insurance rates. People may also begin to perceive the location as unsafe, thus reducing attendance, especially among the elderly. Therefore, leaders of places of worship should learn why vandals commit these acts, and how they can be reduced.

Vandals and Their Motives

Many social scientific studies have involved interviews with persons who engaged in vandalism, revealing a number of common patterns. Most vandalism to places of worship, schools, businesses, and homes consists of breaking glass doors or windows, defacing surfaces with graffiti, and breaking objects (such as smashing signs or ripping off gutters or siding). Vandals also sometimes enter the building to destroy and deface the interior, but such acts are far less common. Almost all vandalism occurs during the times of day, or days of the week, when the building is unoccupied. The overwhelming majority of vandals are youths and young adults between the ages of 10 and 23.[ii] (An exception would be vandals who are seeking to steal metals for profit, such as aluminum siding, but these types of offenders are thieves, not vandals, and have different motives.[iii])

Some vandals, who focus almost exclusively on graffiti, fancy themselves as cutting edge ‘avant garde’ artists. Most vandals, however, are simply seeking a thrill, committing vandalism for the emotional rush of the risk, and to lash out at authority / dominant social norms. While what they write in their graffiti may suggest a particular bias, in most cases this is more of an attempt to ‘get under your skin’ than it is a representation of any truly organized or committed group. In other words, the data indicates that the same group of vandals are just as likely to paint demonic symbols on a Christian church, swastikas on a Jewish synagogue, or racist words on an African-American church. When caught, the vast majority of these vandals are revealed to be troubled teens – not an organized hate group.[iv] They get pleasure from effectively lashing out at symbols of authority, and what greater symbol of authority is there than God? 

Not Totally Random

Not all places of worship (or schools, businesses, etc.) are targeted equally, as some places receive much more vandalism than others. While some places of worship are never vandalized, others are vandalized repeatedly over the course of a year. Interviews with vandals have revealed distinct characteristics associated with their selection of a place to vandalize. Understanding these characteristics can help places of worship reduce their likelihood of future victimization.[v]  

Strength of Local Social Norms

Vandalism is far more likely to occur within neighborhoods that are suffering a breakdown of social institutions, such as the family, schools, community organizations, and churches. As a result, youths in these neighborhoods are more likely to learn deviant social norms (lack of respect for authority, ‘do to others before they do to you’, etc.) and less likely to learn prosocial norms. Vandalism is more likely to occur in such neighborhoods because it sometimes appears this behavior is normal and tolerated by society. Graffiti and damaged properties that go unaddressed tend to breed more graffiti and damaged properties.[vi]

Nevertheless, these are the types of communities that are probably in greatest need of ministry from religious institutions. The more religious institutions become an integral part of the neighborhoods in which they are located, the less likely they are to be vandalized.[vii] Outreach and ministry to the people living within walking distance of the institution can reduce vandalism potential. This usually mean more than simply evangelizing – it means being a good neighbor. Host a block party, provide meals to the needy or shut-ins on the block, assist neighbors with removing their own graffiti or repairing vandalism damage. Such activities will increase social support for the religious institution and increase the strength of local social norms against damaging the neighborhood church. 

Effort

Very few vandals are high achievers in life, focused on long term goals and imbued with grit and determination. In fact, most are generally quite lazy and seek immediate gratification.[viii] As a result, the more effort required to commit the crime, the fewer the vandals that are interested in committing it. Therefore, anything that makes the offense harder to commit, reduces the likelihood of vandalism. For example, buildings situated closer to the street, or other travelled footpaths, are more likely to be vandalized than buildings set father back because offenders have to go father out of their way to commit their crimes. This has actually been demonstrated in several studies.[ix] 

Besides close proximity to the potential vandal’s normal travel path, there are other features that increase the ease of committing vandalism. Leaving paint, tools, or ladders unattended on the property creates a temptation to would-be vandals and increases the ease of committing vandalism. Easy access when no one is around, such as unlocked doors or open gates, also reduces the effort for vandals. Using rocks and gravel in landscaping, or for parking lot material, can provide vandals with ‘on-site tools’ for breaking windows, smashing locks, or scratching graffiti on walls or windows.

To increase the effort involved in committing vandalism, places of worship can ensure that no materials (especially paint and tools) are left out that vandals could use to damage the building. In landscaping, rocks could be replaced with mulch, topsoil, sand, or boulders too big for vandals to lift. Loose bricks or cobblestones should be securely cemented. Landscaping, especially shrubs with thorns, could be planted along the edge of the building, making it inconvenient to get close to walls or windows. Large, flat exterior wall surfaces, especially those of all one color, can seem like a perfect painter’s canvas, beckoning the would-be vandal to come and write. Large flat surfaces could be made harder to deface by planting trees or climbing vines. Anything that can make the structure a less convenient target can help.[x]

Risk

While a primary motivation for vandalism is the thrill of doing something dangerous, thrill seeking has its limits. The higher the likelihood of getting caught or detected before the act is completed, the fewer vandals there are willing to commit the act. Therefore, anything that increases the likelihood of being detected in the act or caught, decreases the likelihood of vandalism.[xi] 

Risk of detection is heightened most by increasing observability. This can be accomplished by ensuring all exterior areas are well lit, and increasing the number of eyes focused on the building. Use of security cameras, strong relationships with those who reside beside the church, and extra patrols requested from the police or a security guard company, can all increase eyes focused on the church. Another way to increase observability is to have the building in use as much as possible as most vandalism occurs when the building is unoccupied. In addition to church-specific activities, places of worship might consider hosting such activities as a daycare or charter school, arts and crafts classes, English as a second language or GED certificate classes, athletic activities, or youth groups such as the Boy Scouts or Girl Scouts. The more often people are in and around the building for prosocial reasons, the less likely the building is to be vandalized.[xii]  

Rewards

The greatest rewards for most vandals are the ability to admire and get attention for their handiwork, and the feeling of power derived from successfully hurting a more powerful entity, such as society, the church, or God.[xiii] Anything that can reduce or deny the vandals these gratifications can help decrease vandalism likelihood.  

In order to reduce the ability of the vandal to admire his or her handiwork, all vandalism should be repaired immediately. Several studies have found that if graffiti is not removed, or broken windows go unrepaired, the likelihood that further vandalism will occur increases dramatically.[xiv] Places of worship that have experienced vandalism in the past might even want to consider creating a budget line item for vandalism repair until the problem abates. After taking photos of the damage for insurance purposes, and filing a police report, paint over or scrub off graffiti as soon as possible. Replace broken glass as soon as possible. (Plywood plugs of broken windows may secure the building in the immediate aftermath, but plywood surfaces make great canvases for additional graffiti in the future.) Deny the vandal the gratification of seeing his or her damage when passing the building again.

Steps should also be taken to reduce the ability of the vandal to feel like he or she successfully inflicted damage on the church. After reporting the incident to the police for legal and insurance purposes, do not draw public attention to the incident. No matter how offensive the damage or graffiti language, do not give the vandals power and reward by reporting the incident to the media or talking about it publicly. If contacted by the media, do no more than issue a simple written statement that tones down the seriousness of the incident. Calling greater attention to the incident only rewards the vandal, emboldens the vandal to strike again, and motivates others to copy the vandal’s actions so that they too can have their work shown on local television (or national) news. If the vandalism is quickly removed, and the situation is handled quickly and discretely by the congregation, the vandal is denied his or her reward

Conclusion

Vandalism of places of worship is a widespread crime problem, but there are things churches, synagogues, and mosques can do to reduce their likelihood of further victimization. There are simple, practical steps religious organizations can take to strengthen neighborhood social norms, increase offender effort and risk, and decrease the rewards of vandalism. If your place of worship has been vandalized recently, it is likely that it will be vandalized again in the near future unless additional measures are taken to change the current situation.  

[i] Bourns, W. & Wright, W. D. (2004). A study of church vulnerability to violence: implications for law enforcement. Journal of Criminal Justice, 32(1), 151-157.

[ii] Allen, V. L., & Greenberger, D. B. (1980). Destruction and perceived control. In A. Baum & J. Singer (eds.), Advances in Environmental Psychology. Hillsdale, NJ: Erlbaum; Canter, D. (1984). Vandalism: overview and perspective. In C. Levy-Leboyer (ed.), Vandalism: Behavior and Motivations. Amsterdam, NE: North Holland Publishers; Coffield, F. (1991). Vandalism and Graffiti: The State of the Art. London, UK: Gulbenkian Foundation; Ferrell, J. (1993). Crimes of Style: Urban Graffiti and the Politics of Criminality. New York, NY: Garland; Fleisher, M. S. (1995). Beggars and Thieves: Lives of Urban Street Criminals. Madison, WI: University of Wisconsin Press; Lasley, J. R. (1996). New writing on the wall: exploring middle-class graffiti writing subculture. Deviant Behavior, 16, 151-167; Sloan-Howitt, M., & Kelling, G. L. (1997). Subway graffiti in New York City: “Gettin’ up” vs. “meanin’ it” and “cleanin’ it.” Crime Prevention Studies, 12, 242-249; Smith, M. J. (2003). Exploring target attractiveness in vandalism: an experimental approach. Crime Prevention Studies, 18, 197-236. Wooden, W., & Blazak, R. (2000). Renegade Kids, Suburban Outlaws: From Youth Culture to Delinquency. New York, NY: Wadsworth; Zsako, J. (2013). Defacing America: The Rise of Graffiti Vandalism. Seattle, WA: CreateSpace Independent Publishing.

[iii] Price, V., Sidebottom, A., & Tilley, N. (2014). Understanding and preventing lead theft from churches: a script analysis. In L. Grove (ed.), Heritage Crime. New York, NY: McMillan.

[iv] Allen & Greenberger (1980); Canter (1984); Coffield (1991); Ferrell (1993); Fleisher (1995); Lasley (1996); Wooden & Blazak (2000).

[v] Canter (1984); Sloan-Howitt & Kelling (1997); Smith (2003); Zsako (2013).

[vi] Allen & Greenberger (1980); Anderson, E. (1999). Code of the Street: Decency, Violence, and the Moral Life of the Inner City. New York, NY: W. W. Norton; Canter (1984); Lasley (1996); Smith, M. J. (2003): Zsako (2013).

[vii] Canter (1984). Coffield (1991); Ferrell, J. (1993); Fleisher (1995).

[viii] Fleisher (1995); Lasley (1996); Wooden & Blazak (2000).

[ix] Brantingham, P. L., & Brantingham, P. J. (1995). Criminality of place: crime generators and crime attractors. European Journal of Criminal Policy and Research, 3(3), 5-26; Brantingham, P. L., & Brantingham, P. J. (1993). Nodes, paths, and edges: considerations on the complexity of crime and the physical environment. Journal of Environmental Psychology, 13, 3-28.  

[x] Price et al. (2014); Sloan-Howitt & Kelling (1997); Smith (2003); Wooden & Blazak (2000); Zsako (2013).

[xi] Canter (1984); Coffield (1991); Fleisher (1995); Lasley (1996); Wooden & Blazak (2000); Zsako (2013).

[xii] Clarke, R. V. (1997). Situational Crime Prevention: Successful Studies. Monsey, NY: Criminal Justice Press.

[xiii] Allen & Greenberger (1980); Canter (1984); Coffield (1991); Lasley (1996); Wooden, & Blazak (2000).

[xiv] Allen & Greenberger (1980); Canter (1984); Coffield (1991); Lasley (1996); Smith (2003): Wooden, & Blazak (2000): Zsako (2013).

Don’t Just Rely On Criminal Justice Students When Trying To Recruit Officers

We frequently hear from law enforcement leaders that they are struggling to recruit enough quality applicants to fill the law enforcement officer vacancies they currently have or soon will have. Often times, agencies look to university criminal justice programs as a pipeline for future officers. On its face, this strategy is a common sense one. Presumably, one would think that university criminal justice students are highly likely to be interested in police work. One would also imagine that they have some knowledge obtained through their studies that will help them successfully complete the application process and transition into the academy.

In 2018, the School of Criminal Justice at the University of Southern Mississippi published a report entitled, Interest in Police Patrol Careers, that involved a large survey of university students in criminal justice courses. These students were surveyed about their interest in a career in uniformed law enforcement. This interesting study may be of some assistance to law enforcement agencies in determining how to allocate recruiting resources in light of the relevant knowledge and interest traits of the criminal justice students that were surveyed.


The Sample

This study involved a survey of 772 undergraduate students enrolled in criminal justice courses at five large public universities in five states – Illinois State University, Indiana University–Purdue University Indianapolis, Missouri State University, University of Massachusetts at Lowell, and University of Southern Mississippi. The overwhelming majority of the respondents were criminal justice students, but their career interests went beyond law enforcement and included the law, private security, corrections, counseling, or forensic science. More than half of the respondents were female (56%), and the racial / ethnic composition of the sample was 72% white, 15% African-American, 7% Hispanic, and 6% all other groups. Two-thirds of the “other” category was composed of respondents who selected “multi-racial” as their race / ethnicity choice. Most of the respondents held positive views of the police within society. Approximately 90% indicated that they had been raised to respect the police, and 88% indicated that the public should respect the police. These undergraduate students were surveyed about their perceptions of employment in law enforcement, the law enforcement officer selection process, and the police academy experience.

It is important to note, however, that many of these students, despite being criminal justice students, lacked a real or accurate understanding of the law enforcement profession. For example, 37% indicated that they did not know what goes on in a police academy, 44% indicated they did not know what a police sergeant does, and 50% indicated they did not know anything about how people were promoted within police departments.

Despite the fact the vast majority were raised to respect the police, and felt the police should be respected, 37% indicated that they believe police officers routinely racially profile citizens, 18% believed police officers shoot citizens frequently, and 25% indicated that they could never in good conscience arrest someone for a marijuana offense.

This discrepancy between the undergraduates’ understanding of police work and reality may be a product of the ideological and theoretical orientation of many state university criminal justice programs today. Less than 10% of full-time criminal justice faculty members at four-year universities today have ever worked as a sworn employee within a law enforcement agency, probation department, or correctional institution, thus having no practical, first-hand knowledge of the criminal justice system to impart. (Note: vocation-oriented community college programs are a clear exception to this trend, with most community college criminal justice faculty members being prior sworn officers.)

Perceptions about the Career

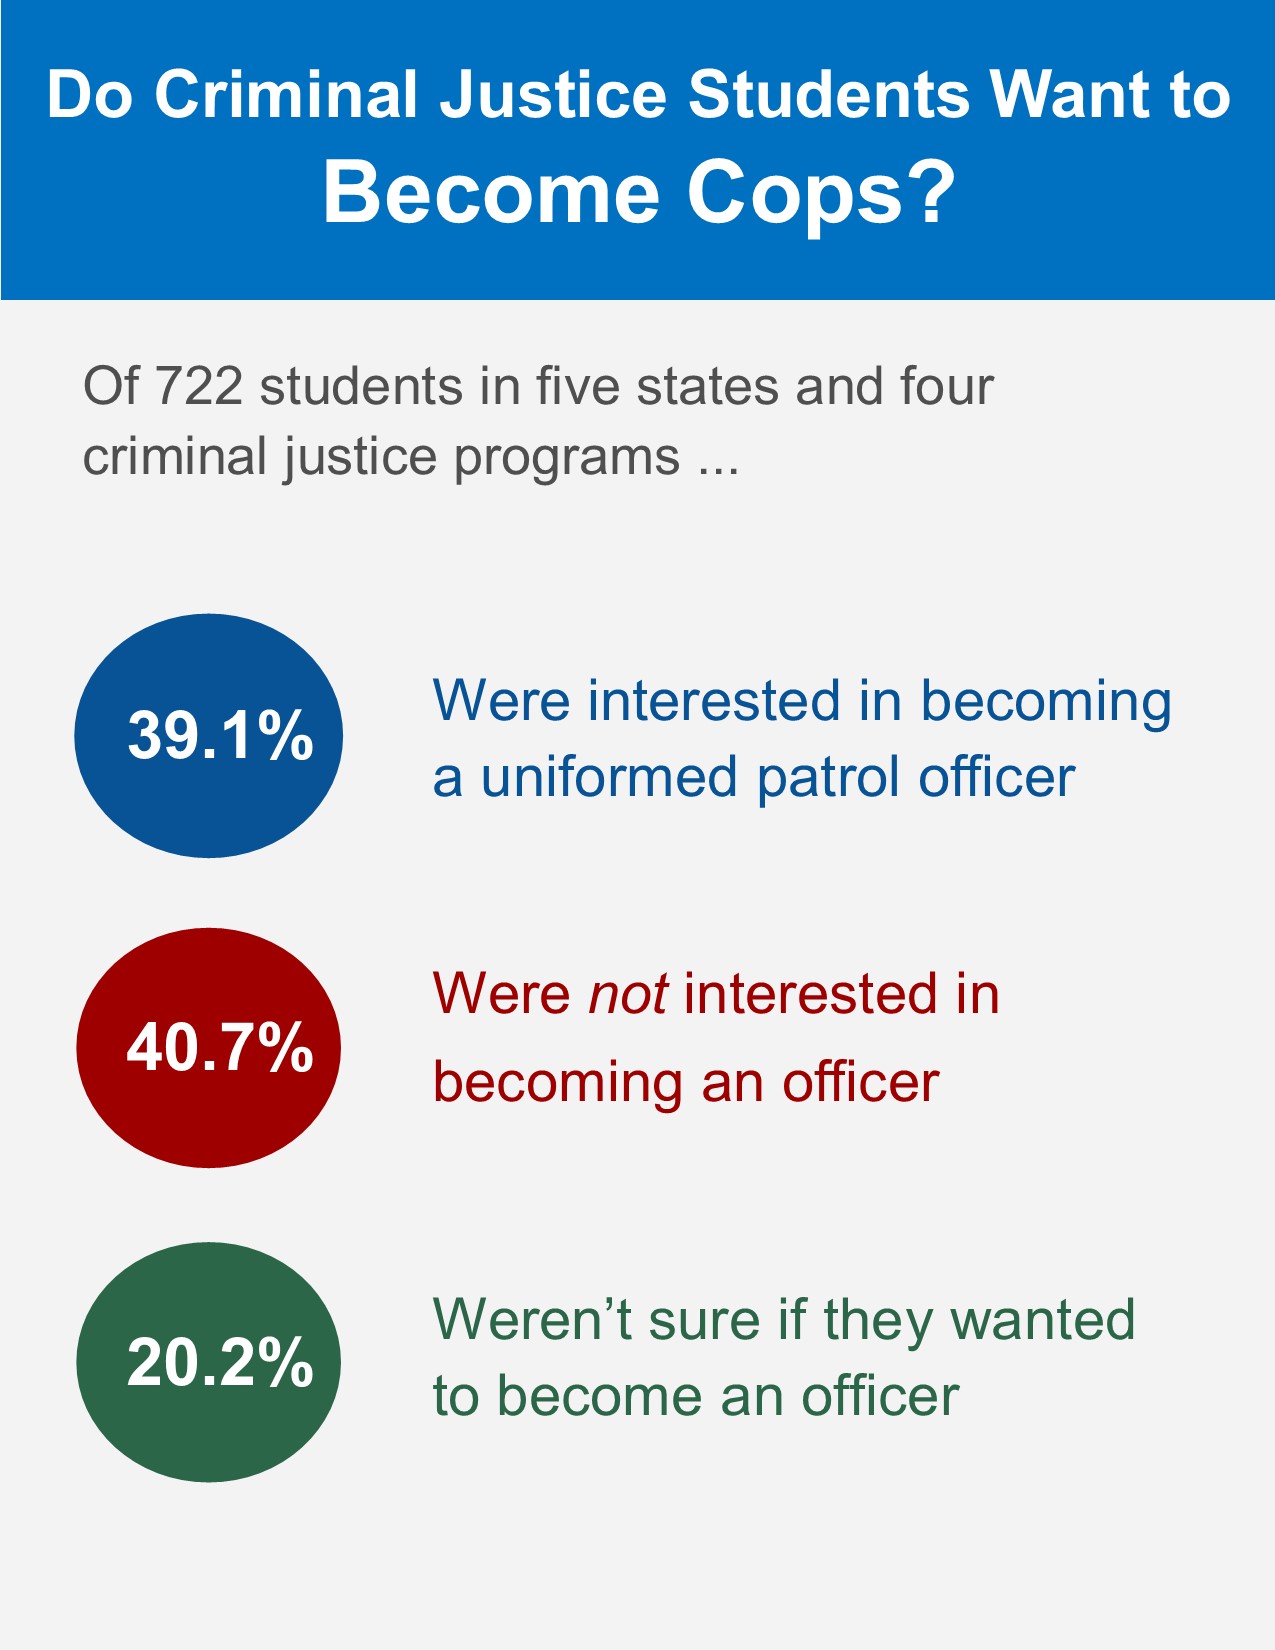
These criminal justice students were asked several questions about their perceptions of law enforcement as a career option. Despite being criminal justice students, or enrolled within criminal justice courses, only 39.1% of students were interested in employment as a uniformed patrol officer, 40.7% were definitely not interested in this work, and 20.2% were not sure. The greatest barriers to pursuing law enforcement as a career option were students’ concerns about compensation and the demands of the job. Approximately 39% of the sample indicated that they thought the salary of a patrol officer would not support the kind of lifestyle they wanted. Keep in mind that these were criminal justice students, so their other career options would be private security, corrections, counseling, forensic lab analyst, defense attorney, or prosecutor—all of which usually have salary ranges similar to, or less than, those of police officers.

Likely these students do not really know how much police officers actually make, or how little these other occupations make. Barring a few isolated exceptions, most law enforcement officers make a middle class wage. Some officers, through overtime pay, earn even more. Agencies may improve their recruiting efforts through communicating how their officers’ salaries, benefits packages, and retirement plans compare to those of other criminal justice careers, or other middle class careers such as teachers, postal workers, nurses, or firefighters.

Almost a quarter of the students (23%) felt that police work was too stressful for them. More than 20% of the students also felt a law enforcement career would interfere with raising a family. The students may have a point here. The evidence does reveal that, compared to other middle class careers, law enforcement officers experience higher rates of divorce and other family dysfunction. This has been attributed to stress, shift work, seeing the worst behavior of humanity, and hypervigilance. Nevertheless, the medical profession, especial nursing and medical technicians (radiology, phlebotomy, etc.) do not have the same high rate of family life dysfunction, despite similar stress, shift work, and constant exposure to death and people in pain. Perhaps the law enforcement profession could benefit from investigating what differences in the work environment of medical workers and law enforcement officers contributes to these differences in family life outcomes.   

Only 12% indicated that they were too fearful of the physical force aspects associated with police work. Similarly, only 10% indicated that they were afraid of using firearms. Clearly, concerns about physical dangers were only a barrier for an inconsequential number of criminal justice students.

Only 14% of the students indicated that their families would not approve of their choice if they selected law enforcement as a career. This varied by race as 28% of African-Americans indicated that their family would not approve, compared to 17% for Hispanics, 10% for whites, and 13% for all other groups. One may initially perceive that this is due to racial differences in views about the legitimacy of the police, but a follow-up question revealed that this issue is far more complex. Only 6% indicated that they would be worried about being labelled as racist for becoming a police officer, and there was no difference between whites and African-Americans in response to this question (7% for African-Americans, 2% for Hispanics, 7% for whites, and 4% for all other groups). These results indicate that family disapproval of a law enforcement career for these students is small and has more to do with concerns about danger, salary, and perceptions of social status of the career rather than race and legitimacy issues.

Clearly the greatest barriers to considering law enforcement as a profession were concerns about earningsconcerns that were probably unrealisticand more valid concerns about stress and family life consequences. This suggests that law enforcement agencies seeking more applicants could benefit from clearly communicating to potential applicants how their pay and benefit packages compare to other middle-class careers and taking all reasonable steps to manage officer stress and improve family quality of life circumstances.   


Perceptions about the Selection Process

Only 16% of the students were scared of having their backgrounds exposed through the law enforcement selection process. Related to this finding, 5% believed their prior criminal history would damage their chances of being hired, 8% worried their past social media posts would disqualify them, and 14% believed their past drug use would prevent their hiring.

While the intrusiveness of the background check was not a deterrent to the vast majority of these students, many were intimidated by the physical fitness requirements. A full 27% indicated that they were afraid of the physical fitness test or the physical fitness training standards they would face in the academy. This trepidation was greater among women, as 42% of the female respondents had apprehensions about the physical fitness standards, compared to only 11% of the male respondents. Physical fitness is a real barrier to applicants and this problem is not going away.

According to 2016 statistics from the U.S. National Center for Health Statistics, 36.9% of Americans aged 20 through 25 are obese (body mass index of greater than 30% body fat). This statistic only refers to obesity and does not count the additional people who are simple overweight or out of shape to a degree that would prevent them from meeting the physical fitness standards for entry as law enforcement officers. Furthermore, university criminal justice programs in the nation rarely require any physical education courses.

As a result, law enforcement agencies may benefit from physical fitness related outreach or career preparation programs. As a form of community outreach to middle schools, high schools, and colleges, perhaps law enforcement officers could provide programs that emphasize getting and staying in good health. Law enforcement agencies (or collaborations between multiple public safety agencies) might seek to establish pre-employment indoctrination programs geared to prepare applicants for the physical rigors of the selection process and the academy (not to try to wash applicants out). Perhaps law enforcement agencies can create applicant preparation programs that meet once or twice a week to help potential applicants get into shape, improve test-taking skills, and learn about the department.               

Perceptions about the Academy

The vast majority of the surveyed criminal justice students understood the necessity of police academy training. Only 6% saw having to attend a police academy as a “deal breaker,” and 13% indicated that they would be apprehensive about attending an academy. Only 7% perceived police academy training as too long. Nevertheless, more than a fifth of the males, and almost half of the females, indicated that they were intimidated by the physical fitness requirements encountered within the academy. This, again, emphasizes the potential impact of positive, proactive outreach efforts regarding physical fitness might have on recruiting efforts.

Conclusion

The information obtained from this large study of criminal justice students revealed several important facts. First, there appears to be no indication that criminal justice students have significantly more knowledge about the realities regarding the law enforcement profession than do other college students. Their education has emphasized sociological concepts and theories, not the practicalities of police work. To attract these students as applicants, law enforcement agencies need to educate them about the realities of the profession, especially its pay, benefits, roles, and responsibilities. Agencies should exploit every opportunity they have to speak to college classes or student clubs, and offer internships where students get to see the realities of the job, but not limit themselves to just criminal justice students.

Second, law enforcement agencies need to continue emphasizing employee physical and psychological wellness to help current employees cope with the stress and rigors of the job while reducing officer hypervigilance. Agencies should explore what other public services occupations do differently that result in more stable families than does the law enforcement profession.

Third, if law enforcement agencies expect applicants from a predominantly overweight and obese nation to pass their physical fitness requirements, they are going to have to engage in more proactive efforts to help potential applicants prepare for these rigors. Doing so can improve the hiring chances of female applicants, as well as improve public perceptions of the police.

Finally, in light of the study’s findings, law enforcement agencies must resist the temptation to assume that university criminal justice programs are necessarily pre-academy pipelines for employment. Rather than producing young men and women who have a keen understanding of police work, this study suggests that non-practitioner professors are producing students who have a striking lack of knowledge about the profession, and a striking lack of interest in the profession. If this study is indicative of university criminal justice programs nationwide, law enforcement agencies may want to be cautious not to overly invest in university criminal justice students when looking for the next generation of law enforcement officers.

Making Discipline Stick in the Fire Service©

Some individuals in government have suggested that grievance arbitrators’ handling of employee discipline cases in the fire service tends to be biased in favor of the employees and against the fire department. The mayor of Cleveland, Ohio, for example, criticized the grievance arbitration process after being required to rehire a number of city employees that had been terminated from various city departments. He argued that the arbitration process keeps bad employees on the job. The mayor of Plattsburgh, New York, when dealing with firefighter employee grievance cases, publicly stated his belief that the decisions of arbitrators “defy logic.” The mayor of New York City, when an arbitration decision required the re-hiring of several city employees who had been terminated for serious acts of misconduct, stated that arbitrators “would give an axe murderer a slap on the wrist.” Leaders in many other cities dealing with orders to rehire firefighters who were terminated for serious acts of misconduct have suggested that the grievance arbitration process is broken.

Prior social science research on grievance arbitration cases involving public employees also reveals that arbitrators frequently find in favor of the employee by reducing, or completely overturning, public employee discipline. A 1995 study examined arbitration decisions from 994 public sector employee discipline cases. It found that arbitrators only upheld the employer’s discipline in its entirety in about 50% of these public sector cases. Another study in 2007 reviewed 806 arbitration cases of public sector employee discipline and, again, found that the arbitrators sided with the employer in only about half of the cases.

If fire departments cannot discipline their employees when corrective action is warranted, several negative outcomes result. First, the employees of the agency will have difficulty determining where the boundaries lie between appropriate and inappropriate behavior—possibly leading to behavior that is not only inappropriate but that results in serious criminal charges. Second, toxic and dysfunctional employees will believe they are untouchable and, as a result, will be emboldened to engage in further misconduct. Third, the morale of the good employees will suffer as they have to continue to work alongside (and entrust their safety too) toxic and dysfunctional individuals. Fourth, the image of the agency and the profession will decline in the eyes of the public and local politicians—politicians and a public that votes on such things as raises, contracts, or tax increases for fire services. Finally, members of management can begin to feel that they have no control over the organization.

Why Employee Discipline is Reduced or Overturned

Why are the corrective actions applied to firefighters and EMTs overturned so often? Are the arbitrators acting so irrationally that fire departments are powerless? The evidence suggests that this is actually not the case. Dolan Consulting Group (DCG) recently studied 661 cases of employee misconduct handled by 276 fire agencies and ambulance services across 44 states. These cases primarily represented situations that resulted in serious disciplines, such as suspensions without pay or employment termination. This study examined what factors were associated with whether or not the employees accepted or challenged their discipline and examined how the discipline challenges were handled by grievance arbitrators or the civil courts. This analysis revealed that there are clear and consistent reasons that employee discipline by fire rescue agencies is overturned almost half of the time.

Grievance Arbitration

Approximately 61% of the disciplined fire rescue personnel in this study appealed their discipline to a grievance arbitrator. In this research study, “grievance arbitrator” was defined very broadly to include the grievance arbitration processes as part of collective bargaining agreements between employers and labor unions, as well as other types of arbitration mechanisms such as civil service boards, employee relations boards, workplace standards boards, or equal employment opportunity boards. These arbitrators ruled in favor of the employee in 54% of the cases by reducing or overturning the employee’s discipline.

In each arbitration decision, the arbitrator provided a detailed explanation of his or her rationale for altering the discipline that had been issued by the employer. In all of the cases favorable to the employee, arbitrators found at least one error—and in some cases, three or four errors–on the part of the employer that justified reducing or overturning the disciplinary action. In 72% of the cases in which the employee discipline was reduced or overturned, the arbitrator noted inconsistent discipline on the part of the employer. Inconsistent discipline can include instances in which the employer issued less severe punishments in the past to other employees who had committed similar offenses. In about 60% of the cases, the employer failed to reach the legal standard of clear and convincing evidence that is required when suspending or terminating employees. In these cases, the employers had relied upon hearsay and weak evidence, while the disciplined employee had stronger evidence refuting their guilt.

In 59% of the cases, the employers were found to have issued disproportionate discipline, meaning that the penalty issued by the employer was disproportionately severe when compared to the seriousness of the misconduct, or was disproportionately severe when compared to the employee’s past record of good performance. In 47% of the cases, the employer was found to have violated the collective bargaining agreement by failing to exercise progressive discipline. Finally, in 40% of the cases, the employer was found to have violated the employee’s due process rights or collective bargaining contract requirements, such as by not providing an impartial hearing, not allowing the employee to present counter-evidence, not providing an impartial determiner of guilt, or failing to meet required deadlines.    

These cases reveal a consistent pattern. Fire rescue departments often see their employee discipline reduced or overturned at arbitration, but primarily for legitimate reasons. The disciplinary process must be legal, fair, and follow proper procedure. These cases were overturned because they each lacked fairness, legality, or they violated proper procedure in multiple ways.

Civil Lawsuits

While grievance arbitration process is frequently criticized, not nearly as much hostility is directed at the civil courts. The civil courts, however, generally come to the same conclusions as the grievance arbitrators. In our study, 17% of the disciplined fire rescue employees chose to contest their discipline through a lawsuit instead of through grievance arbitration. The courts sided with the employer as frequently as did the arbitrators. Only 59% of these lawsuit cases were decided in favor of the employer, with the courts reducing or overturning the employee’s discipline in 41% of the cases. This suggests that grievance arbitrators and the civil courts resolve cases in a similar manner.

When examining the civil court judges’ justifications for reducing or overturning the fire rescue agency’s discipline, the judges cited the same reasons as the arbitrators. All of the lawsuits that were decided in favor of the employees cited multiple employer errors that warranted altering the employee’s discipline. These employer errors included violation of the employee’s due process rights or collective bargaining agreement requirements (79%), lack of clear and convincing evidence of guilt (60%), disproportionate discipline (29%), inconsistent discipline (24%), and failure to exercise progressive discipline (9%).

Getting a Second Opinion

It appears that there is nothing unique about the way grievance arbitrators reach decisions in discipline cases. Grievance arbitrators side with the employer at a similar rate as do the civil courts, and reduce or overturn employee discipline for the exact same reasons as do the civil courts. It should not be surprising, therefore, that trying to appeal the outcome of binding arbitration in court rarely changes the result. In our study, 45% of the cases that went to arbitration were later taken to civil court by the losing party to overturn the arbitrator’s decision. In these cases the civil court judges upheld the arbitrator’s decision the vast majority of the time.

In situations where the employee lost at arbitration (remaining terminated or suspended), but then filed a lawsuit against the department in court, the court upheld the arbitrator’s decision 95% of the time. In situations where the employer sued to block the arbitrator’s order to reduce or remove the employee’s discipline, the court still upheld the arbitrator’s decision 70% of the time. Even in the 30% of cases in which the court sided with the employer, the majority of these cases involved adjusting the arbitrator’s order because the conditions or the ruling could not be fulfilled. For example, several of these cases involved an order to fully reinstate an EMT or paramedic, but the state had revoked the employee’s EMT credentials, making reinstatement as an EMT impossible. In such cases the judges simply modified the arbitrator’s ruling so that the employee was reinstated as a firefighter rather than as an EMT. The judges only completely overturned the arbitrator’s ruling in a couple of cases, and this was only when it could be proven that the arbitrator had grossly exceeded his or her authority.

Five Reasons Discipline was Overturned

Fire agencies can implement effective discipline that won’t get overturned by addressing common mistakes that they may or may not be making.

#1 – Disproportionate Punishment

The most common reason cited for overruling the employer’s discipline was that punishment was distributed unfairly. In most cases, this involved situations where discipline was distributed unevenly. These are cases where two employees who shared similar past performance histories committed similar acts of misconduct, yet one employee was punished far more severely than the other. Employees must be treated evenly when being given punishments and the only aggravating or mitigating circumstance that can justify different punishment outcomes for the same type of behavior is a record of prior misconduct. Arbitrators overturned punishments if it appeared the severity of the punishment depended on anything else, including the employee’s rank, years of experience, personal friendships, race, sex, or even attitude and lack of remorse. Only the seriousness of the offense and the employee’s prior record of misconduct should matter.

Arbitrators also reduced or overturned discipline on the basis of disproportionate punishment if the punishment was far more severe than the seriousness of the act of misconduct would warrant. In other words, if the case involved a minor act of misconduct that was given a severe punishment rather than a minor punishment, or retraining in the spirit of progressive discipline, it was likely to be overturned by the arbitrator. Some of these discipline decisions may have been, in fact, “last straw” offenses for an employee who had been exhibiting problem behavior for some time. If this prior past misconduct had not been documented and addressed, however, courts and arbitrators are unwilling to take these past problems into consideration.

#2 – Insufficient Evidence

The second most common justification for overturning employer discipline involved insufficient proof of misconduct. While civil courts often utilize the “preponderance of the evidence” standard of proof in civil lawsuits, arbitrators generally use the higher standard of proof of “clear and convincing.” The clear and convincing standard means that the information presented is substantially more probable to be true than not true. This standard of proof is a higher degree of proof than the “preponderance of the evidence, and it also the standard of proof utilized by arbitrators”. If the law enforcement agency only utilizes the lower preponderance of the evidence standard of proof when gathering evidence and determining whether an employee committed a particular act of misconduct, the employer risks having the discipline overturned by an outside arbitrator.

#3 – Due Process Violations

The third most common reason arbitrators overturn a law enforcement agency’s discipline is that the employer violated the employee’s due process rights when investigating the employee misconduct, determining guilt, or assigning punishment. Public employees are afforded certain due process rights by the U.S. Supreme Court, and by statutes and legal precedents within each state. These rights generally include a complete and impartial investigation, notice of the charges against the employee, an opportunity to challenge the charges with rebuttal evidence, and a determination of guilt by an unbiased hearing officer. Even murderers and terrorists are afforded their due process rights by the criminal justice system when they are investigated, arrested, and prosecuted. Therefore, no matter how serious the employee’s act of misconduct, and no matter how much evidence there is against the employee, if the employer violates these rights, the discipline is likely to be overturned, just as a criminal can walk free if his or her due process rights are violated in the criminal context.

#4 – Procedural Errors

Procedural errors, such as failing to follow written policies or the agency’s collective bargaining agreement, came next in frequency as a justification to overturn an employer’s discipline. If a law enforcement agency fails to follow any of its own written procedures for handling employee discipline, it risks having its discipline overturned. The same is true for violations of its collective bargaining agreement with its employee’s union, as this “agreement” is actually a legally binding contract. Violations of a legal contract will bring legal repercussions for the party that violates the contract. If there is a time limit for filing misconduct charges, for example, then this time limit must be met. If the contract permits employees to have a union representative present during questioning, then a union representative must be contacted and be present.

#5 – Other Mitigating Circumstances

To a much lesser extent, a collection of other mitigating circumstances were mentioned by arbitrators as additional justifications that helped sway them to overturn an employer’s discipline. The most common of these was the employee’s past record of good performance. When issuing punishments, arbitrators expected employers to show leniency toward employees with lengthy employment histories of outstanding past performance. Therefore, if past misconduct was not documented, it was irrelevant to the arbitrators’ decision. As a popular saying goes, if it’s not in writing, it didn’t happen.

Arbitrators usually expected employers to demonstrate some form of harm that resulted from the employee’s misconduct in order to justify the punishment. Arbitrators usually have never been police officers and they do not understand your job. Employers often need to explain what repercussions specific acts of misconduct may have on the community or the department.

Finally, arbitrators tended to review the circumstances surrounding the misconduct by what was objectively reasonable from the perspective of the employee at the time, rather than the reality of facts that were determined later. This was the standard set by the U.S. Supreme Court in Graham v. Connor. It requires asking the question, “Based on what the officer knew, heard, smelled, and saw at the time, were the officer’s actions reasonable?” Arbitrators expect employers to employ this standard.

Making Discipline Stick

DCG staff have taken the findings from this research study of fire rescue employee discipline cases and developed an evidence-based course to not only educate fire rescue leaders about the reasons for discipline reversals but also provide strategies to help ensure that discipline is delivered in a fair manner that will stand up to external arbitrator review. Called Making Discipline Stick in the Fire Service©, this course is designed to assist supervisors, human resources professionals, city attorneys, agency executives, and union leaders in the fire rescue profession by increasing their knowledge about the most frequent causes of discipline reversals. When arbitrators and judges give written justifications for their decisions, they always provide advice to the employer about how the case should have been handled. This course uses the very words and insights from these arbitrators and judges to help fire rescue agencies improve the fairness of their disciplinary processes and increase the likelihood the employee discipline they hand down will remain in place after external review.

About the Author

Matt Dolan is a licensed attorney who specializes in training and advising public safety agencies in matters of legal liability. His training focuses on helping agency leaders create sound policies and procedures as a proactive means of minimizing their exposure to costly liability. A member of a law enforcement family dating back three generations, he serves as both Director and Public Safety Instructor with Dolan Consulting Group.

His training courses include Recruiting and Hiring for Law EnforcementConfronting the Toxic OfficerPerformance Evaluations for Public SafetyMaking Discipline Stick®, and Supervisor Liability for Public Safety.

Making Discipline Stick in Law Enforcement©

Some individuals in government have suggested that grievance arbitrators handling of law enforcement officer discipline cases tends to be biased in favor of the employees and against management. Cleveland Mayor Frank Jackson, for example, has criticized the grievance arbitration process after being required to rehire a number of police officers that had been terminated from the Cleveland Police Department. Mayor Jackson argued that the arbitration process “keeps bad cops on the force.”

Former Police Chief Cathy Lanier of the Washington Metropolitan Police Department in Washington, DC faced similar issues, being forced to reinstate officers her department had terminated for significant acts of misconduct. In a December 24, 2013 letter to the editor published in the Washington Post, Chief Lanier wrote the following:

One of my greatest frustrations is an arbitration process for employee terminations that, on multiple occasions, has required the department to rehire officers who had been fired for misconduct. In fact, we’ve had several instances in which an officer was fired for misbehavior, the case went to arbitration and the arbitrator ruled that we had to rehire the individual, who was subsequently arrested for additional misconduct. As a result of arbitration, we are regularly required to rehire individuals who simply have no business being on this police force. Often, arbitrators in these cases don’t appear to have the best interests of D.C. residents in mind.”

Situations such as these have caused some to question the legitimacy of the workplace grievance arbitration process with regard to law enforcement officers. In 2002, Chicago Police Board member Mark Iris, for example, wrote, “Given that disciplinary suspensions went through multiple stages of internal scrutiny before any discipline was imposed, it seemed reasonable to expect that arbitrators would have upheld management’s actions at a much higher proportion.” Iris went on to argue that the police grievance arbitration process was simply “arbitrary,” seeking to negotiate down the severity of punishments rather than looking at the evidence.

Prior research on grievance arbitration cases involving public employees, however, does not reveal that arbitrators either ignore the evidence or simply seek to mediate a “middle ground” punishment between the employer and the union. A 1995 study examined arbitration decisions from 994 public sector employee discipline cases. It found that arbitrators upheld the employer’s discipline in its entirety in about 50% of these public sector cases, but did reduce or completely overturn the employee’s discipline in the other half of the cases. A 2007 study reviewed 806 arbitration cases of public sector employee discipline and, again, found that the arbitrators sided with the employer in about half of the cases.

Dolan Consulting Group (DCG) analyzed a nationwide sample of 377 cases of serious law enforcement officer discipline (demotions, suspensions, and terminations) that went to arbitration review between January 1, 2006, and December 31, 2015. In these law enforcement-specific cases, the arbitrator sided with the employer and upheld the discipline 55% of the time. However, in 45% of the cases, the arbitrator did reduce or completely overturned the employee’s discipline. In the overwhelming majority of cases, arbitrators cited specific management investigative, procedural and consistency failures that led to the decision to overturn or reduce discipline.   

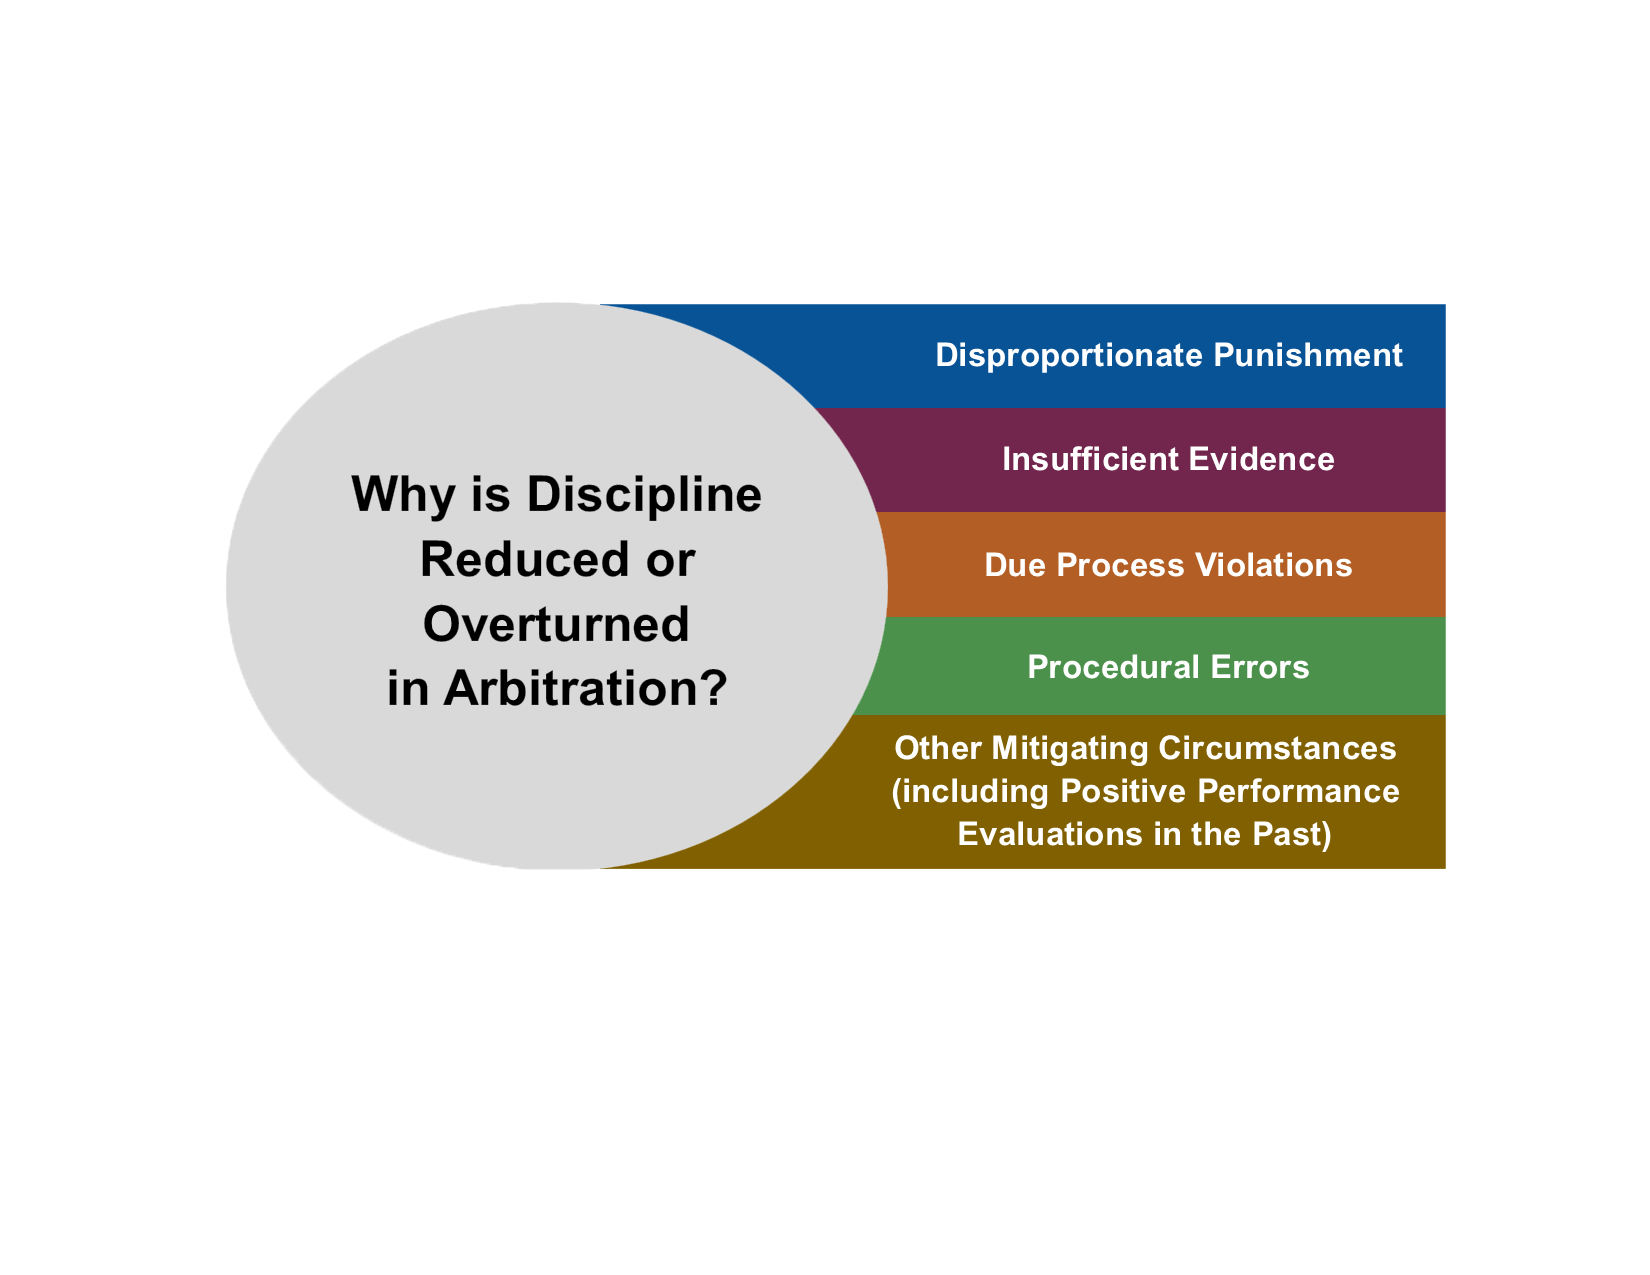
Why is Discipline Reduced or Overturned?

It appears that almost half of the time a law enforcement agency seeks to apply significant corrective action in response to an employee’s acts of misconduct, this discipline is not upheld by an arbitrator almost half of the time. This clearly hampers leadership’s ability to hold employees accountable for reckless, negligent, or criminal behavior. This situation makes it difficult for law enforcement agencies to rid themselves of “bad apples,” lowering agency-wide morale, damaging the legitimacy of the police in the eyes of the public, and increasing legal liability for the department. It is extremely important, therefore, that law enforcement agency leaders learn what errors have led to discipline reversals in the past, so they can avoid those errors in the future.     

In analyzing its sample of 377 law enforcement employee discipline arbitration cases, DCG was able to identify the five most common reasons given by arbitrators to justify their decisions to reverse or reduce discipline issued to law enforcement officers.

#1 – Disproportionate Punishment

The most common reason cited for overruling the employer’s discipline was that punishment was distributed unfairly. In most cases, this involved situations where discipline was distributed unevenly. These are cases where two employees who shared similar past performance histories committed similar acts of misconduct, yet one employee was punished far more severely than the other. Employees must be treated evenly when being given punishments and the only aggravating or mitigating circumstance that can justify different punishment outcomes for the same type of behavior is a record of prior misconduct. Arbitrators overturned punishments if it appeared the severity of the punishment depended on anything else, including the employee’s rank, years of experience, personal friendships, race, sex, or even attitude and lack of remorse. Only the seriousness of the offense and the employee’s prior record of misconduct should matter.

Arbitrators also reduced or overturned discipline on the basis of disproportionate punishment if the punishment was far more severe than the seriousness of the act of misconduct would warrant. In other words, if the case involved a minor act of misconduct that was given a severe punishment rather than a minor punishment, or retraining in the spirit of progressive discipline, it was likely to be overturned by the arbitrator. Some of these discipline decisions may have been, in fact, “last straw” offenses for an employee who had been exhibiting problem behavior for some time. If this prior past misconduct had not been documented and addressed, however, courts and arbitrators are unwilling to take these past problems into consideration.

#2 – Insufficient Evidence

The second most common justification for overturning employer discipline involved insufficient proof of misconduct. While civil courts often utilize the “preponderance of the evidence” standard of proof in civil lawsuits, arbitrators generally use the higher standard of proof of “clear and convincing.” The clear and convincing standard means that the information presented is substantially more probable to be true than not true. This standard of proof is a higher degree of proof than the “preponderance of the evidence, and it also the standard of proof utilized by arbitrators”. If the law enforcement agency only utilizes the lower preponderance of the evidence standard of proof when gathering evidence and determining whether an employee committed a particular act of misconduct, the employer risks having the discipline overturned by an outside arbitrator.

#3 – Due Process Violations

The third most common reason arbitrators overturn a law enforcement agency’s discipline is that the employer violated the employee’s due process rights when investigating the employee misconduct, determining guilt, or assigning punishment. Public employees are afforded certain due process rights by the U.S. Supreme Court, and by statutes and legal precedents within each state. These rights generally include a complete and impartial investigation, notice of the charges against the employee, an opportunity to challenge the charges with rebuttal evidence, and a determination of guilt by an unbiased hearing officer. Even murderers and terrorists are afforded their due process rights by the criminal justice system when they are investigated, arrested, and prosecuted. Therefore, no matter how serious the employee’s act of misconduct, and no matter how much evidence there is against the employee, if the employer violates these rights, the discipline is likely to be overturned, just as a criminal can walk free if his or her due process rights are violated in the criminal context.

#4 – Procedural Errors

Procedural errors, such as failing to follow written policies or the agency’s collective bargaining agreement, came next in frequency as a justification to overturn an employer’s discipline. If a law enforcement agency fails to follow any of its own written procedures for handling employee discipline, it risks having its discipline overturned. The same is true for violations of its collective bargaining agreement with its employee’s union, as this “agreement” is actually a legally binding contract. Violations of a legal contract will bring legal repercussions for the party that violates the contract. If there is a time limit for filing misconduct charges, for example, then this time limit must be met. If the contract permits employees to have a union representative present during questioning, then a union representative must be contacted and be present.

#5 – Other Mitigating Circumstances

To a much lesser extent, a collection of other mitigating circumstances were mentioned by arbitrators as additional justifications that helped sway them to overturn an employer’s discipline. The most common of these was the employee’s past record of good performance. When issuing punishments, arbitrators expected employers to show leniency toward employees with lengthy employment histories of outstanding past performance. Therefore, if past misconduct was not documented, it was irrelevant to the arbitrators’ decision. As a popular saying goes, if it’s not in writing, it didn’t happen.

Arbitrators usually expected employers to demonstrate some form of harm that resulted from the employee’s misconduct in order to justify the punishment. Arbitrators usually have never been police officers and they do not understand your job. Employers often need to explain what repercussions specific acts of misconduct may have on the community or the department.

Finally, arbitrators tended to review the circumstances surrounding the misconduct by what was objectively reasonable from the perspective of the employee at the time, rather than the reality of facts that were determined later. This was the standard set by the U.S. Supreme Court in Graham v. Connor. It requires asking the question, “Based on what the officer knew, heard, smelled, and saw at the time, were the officer’s actions reasonable?” Arbitrators expect employers to employ this standard.

Making Discipline Stick

DCG staff have taken the findings from this research study of 377 law enforcement employee discipline cases and developed an evidence-based course to not only educate law enforcement leaders about these five reasons for discipline reversals, but also provide strategies to help ensure that discipline is delivered in a fair manner that will stand up to external arbitrator review.

Called Making Discipline Stick in Law Enforcement©, this course is designed to assist supervisors, human resources professionals, city attorneys, agency executives, and union leaders in law enforcement by increasing their knowledge about the most frequent causes of discipline reversals. When arbitrators give a written justification for their decision, they always provide advice to the employer about how the case should have been handled. This course uses the very words and insights from these arbitrators to help public sector agencies improve the fairness of their disciplinary processes and increase the likelihood the employee discipline they hand down will remain in place after arbitrator review.

About the Author

Matt Dolan is a licensed attorney who specializes in training and advising public safety agencies in matters of legal liability. His training focuses on helping agency leaders create sound policies and procedures as a proactive means of minimizing their exposure to costly liability. A member of a law enforcement family dating back three generations, he serves as both Director and Public Safety Instructor with Dolan Consulting Group.

His training courses include Recruiting and Hiring for Law EnforcementConfronting the Toxic OfficerPerformance Evaluations for Public SafetyMaking Discipline Stick®, and Supervisor Liability for Public Safety.

Your Department Doesn’t Match the Diversity of your Community?

Consider The Effects of Rapidly Changing Demographics

Public safety agencies are facing ever-increasing pressure to have the racial and ethnic diversity of their employees match or exceed the racial and ethnic diversity found within the communities. Sheriffs, police chiefs, and fire chiefs are often being called to account by municipal government leaders, citizens’ groups, outside activists, and the news media for having a higher proportion of white employees than the proportion of the community that is currently white.

One element that is missing from this conversation, however, is how fast did the demographic composition of the city change? Is it possible that the community was transformed from a majority white to a majority non-white population over the course of just a few years? If so, then it is very likely that part of the situation that needs to be discussed is employee longevity. If the police department or fire department was representative of its mostly-white community when a large group of new employees was hired, one should expect that the agency will keep this mostly-white structure for many years as these employees serve 20, 25, or 30 year careers.

As good employees are retained and encouraged to stay until they are eligible for retirement, it takes a long time for the racial composition of a public safety agency to change. Sometimes it takes much longer for the demographics of an agency to change that it takes for the demographics of a community to change. One also needs to consider the economic effects of a large and rapid racial demographic change within a community. Sometimes a rapid shift in racial demographics coincides with a decline in property values. As a result, the tax funding for public safety sometimes declines, making it more difficult to hire any firefighters or police officers, much less racially diverse ones.

Below are two examples of communities that well illustrate how rapidly the racial demographics of a community can change.   

Compton, California

Compton, California is a suburb of Los Angeles that currently has a population of approximately 97,000 inhabitants. It expanded in the 1950s with an orientation toward the housing of professionals employed by the airline industry. Near Los Angeles International Airport (LAX), its early residents were predominantly airline pilots, flight attendants, aircraft mechanics, and air traffic controllers. As Figure 1 illustrates, the community has undergone multiple rapid changes in racial demographics before, during, and after that growth. Up until the end of World War II, the city was almost exclusively white and was 88% white in 1950. Over the next 20 years, however, the proportion of the population that was African-American grew from 10% in 1950 to 70% in 1970. In less time than a typical 25-year law enforcement officer’s career, the city went from a very small African-American population to a predominantly African-American population.    

Figure 1. Compton, California Racial Demographic Changes 1930-2016

Data source: U.S. Census Bureau

The small Compton Police Department hired its first African-American police officer in 1958, and as the city grew, many more African-American officers and police chiefs were hired. Nevertheless, a common theme of protests in Compton during the 1960s, and through the early 1990s, was that the police force was not representative of the predominantly African-American community it policed. This lack of “representativeness” was due, however, to the speed at which the population changed and the fact that white officers, who were hired when the community was predominantly white, stayed until retirement.

Additional racial strife resulted in Compton during the late 1990s as the majority of city government positions became held by African-Americans by that time, but the Hispanic and Asian-American populations of the city blossomed exponentially. New Hispanics and Asian-American residents, who became the majority during the 2000s, were demanding representation in a local government dominated by African-American employees. This was one factor motivating the city to disband its predominantly African-American police force in 2000, and opting to contract with the Los Angeles County Sheriff Office (a more diverse agency) for police protection.

Perry, Iowa

Compton serves as an example of large and swift racial demographic changes in a larger community within a metropolitan environment. What about small rural communities? Can the same thing happen there? Perry, Iowa is a small, rural town with a current population of about 7,700 inhabitants. It is located in Dallas County (population only 66,000) and is approximately 40 miles northwest of Des Moines. The primary industries in the town are farming and a pork processing plant. Figure 2 below illustrates that racial changes within Perry from 1950 through 2016.

From 1950 through the mid-1970s, the town was overwhelmingly white. In 1950 the town population was 98% white, and in 1970 the town population was still approximately 96% white. During that span of time, the few members of racial minority groups residing in the town (less than 300 individuals) were African-Americans, Asian-Americans, and Native Americans.

The 1980s and 1990s, however, saw major population changes that included an influx of Hispanic residents, primarily drawn to the community by jobs on farms and at the new pork processing plant. At the same time, Perry felt the nationwide increase of people leaving both urban and rural areas in favor of living in suburbia. While in past decades the majority of rural Americans lived almost their entire lives within the same community, the post-World War II era saw more and more rural young adults go off to college, never to return to the farm or small town. This era also saw the massive increase in the trend of retirees moving to places like Florida or Arizona to live out their remaining years in warmer climates. As more whites left the community, new Hispanic residents moved in to fill the growing job vacancies.

Figure 2. Perry, Iowa Racial Demographic Changes 1930-2016

All of these factors saw the small town’s racial/ethnic population transform – especially rapidly during the 1990s and 2000s. In 1980 the town’s population was still 93% white, but just 20 years later, in 2000, the town’s population had changed to 72% white, 25% Hispanic, and 3% African-American, Asian-American, and Native American. In just 10 years after that, in 2010, the town was on the verge of becoming majority non-white, as 56% of inhabitants were white, 37% were Hispanic, and 4% were African-American, Asian-American, and Native American.

These are rapid changes that happened much more quickly than the standard rate of employee turnover in a police department. Note, however, that the pattern of change has continued but in a different direction. Primarily due to economic factors, such as the sub-prime mortgage crisis and the Great Recession of 2008-2014, the Hispanic population has now been decreasing in Perry since 2009. The most current available Census data indicates that Perry’s population was 59% white in 2017, a 3% increase over just 7 years. Again, the speed at which these racial demographic shifts can occur often is much faster than the rate of officer turnover on most police departments.             

Conclusion

The racial composition of a police force or fire department is a highly complex issue, far more complicated than protestors, politicians, or the media seem to understand. One important facet of this many-sided issue is the influence a rapid change in racial demographics can have. Communities legally cannot, and ethically should not get rid of existing employees just because their race or ethnicity does not match that of the majority of the majority of individuals who reside within the city or town. If one group rises to a majority or supermajority in a short period of time, it will take decades for the hiring of new employees and retiring of existing employees to mirror that change. By that time, as was the case in Compton, the racial composition of the community may have shifted again.

What is most important in evaluating the fairness of the hiring process is to ask: what is the agency doing right now? If a mostly-white law enforcement agency has officer vacancies, and a non-white segment of the population has grown substantially in recent years, that department should make a strong effort to recruit new officers from members of the growing population group. Public safety agencies should also try to hire qualified individuals from a diverse array of backgrounds, and the deeply American value of equal opportunity should drive agencies to avoid excluding qualified applicants from a specific race, ethnic, gender, or sexual orientation demographic groups. Having an expectation that the racial demographic composition of all police or fire departments should perfectly mirror the racial composition of the community at all times is often unrealistic, however, and ignores the realities of legitimate constraints of public safety hiring.

Contact Us for Research Services

If your law enforcement or fire service agency is facing concerns that the racial or ethnic composition of its personnel does not match the demographic composition of the community, then we encourage you to contact us about the research services available to you. We provide research consulting services on this issue that can include examining recent population and economic shifts in the community. We also can examine how the racial and ethnic composition of the community may differ from the racial and ethnic composition of the pool of individuals in the local area who meet the most basic qualifications for employment by your agency (i.e., meets the age, education, citizenship, language proficiency, and employability requirements of your agency). Make sure your agency has solid facts when responding to these community concerns.   


Reducing Crime and Calls for Service through Nuisance Abatement

A nuisance abatement law is a local ordinance holding property owners civilly liable to the city for excessive criminal law or health code violations that occur on their premises. Under most of these ordinances, property owners can be assessed fees or fines in civil court to reimburse the city for excessive use of public safety services due to physical conditions and repeated human behaviors found at their properties. The logic behind such an ordinance is the deterrence of conditions that contribute to repeat crimes and calls for police services that disproportionately consume city resources.

In 2008, such an ordinance was passed by the city council in Lakewood, Ohio, a suburb in the Cleveland Metro Area. Several years after its successful implementation, some objections began to be raised about the ordinance. Some of the objections came from nuisance property owners, especially absentee landlords, who were reluctant to make the improvements necessary to reduce crime and disorder at their properties. Some objections also came from a group of social work professors from a metro area university who teamed up with the American Civil Liberties Union (ACLU) in an effort to stamp out all nuisance abatement ordinances in the Cleveland Metro Area. This team, using a handful of anecdotal examples, was arguing that nuisance abatement ordinances unfairly punished victims of domestic violence, mentally ill individuals, poor persons, and racial minorities. This opposition also coincided with the national wave of anti-police protests and media stories during 2014 through 2016.

In response to this growing opposition, the Lakewood Police Department requested an evaluation of the impact the Lakewood nuisance ordinance had on the community. A Dolan Consulting Group researcher examined the impact on crime and calls for service the ordinance had on the first 150 addresses to which the ordinance had been applied.

How Nuisance Ordinances Work

Extensive social scientific research has revealed that crime and disorder tend to concentrate at specific geographic locations known as “hot spots.” Hot spot locations tend to attract individuals currently motivated to commit crimes or to act in a disorderly manner. For example, taverns or dance clubs are far more likely to be crime hot spots than are churches and nursing homes. Apartment residents who are permitted to hold large parties, play music loudly, harbor prostitution, or sell drugs are more likely to experience disturbances of the peace due to disputes between customers, guests, or neighbors. In addition to attracting potentially troublesome individuals, hot spot locations are also more likely to provide suitable targets for these offenders. Suitable targets include people who are more easily victimized (children, the elderly, the mentally ill, the poor, people who are intoxicated, etc.) or things one can easily steal or destroy.

Crime only occurs, however, when these potential offenders and suitable targets meet in time and space at a specific location. If that location lacks sufficient protective measures to discourage the offender and provide the targets some protection, a crime is likely to occur. If a tavern, for example, uses advertising to attract young men to watch a boxing match on their big-screen television, allows the bar to become very crowded, permits betting on the fight to occur, has no security presence, and encourages excessive drinking, it is likely to have to call the police for fights and arguments.

The research has also revealed that place managers, such as apartment landlords or bar owners, make important decisions regarding the physical conditions of the address, permissible conduct tolerated at the address, access to the address, and presence of certain illegal or troublesome products (such as drugs, alcohol, or weapons) at the address When these place managers choose to neglect basic community standards and business practices that facilitate safety and orderliness at their addresses, these addresses tend to invite criminal and disorderly behavior.

Nuisance ordinances seek to incentivize property owners to maintain their properties appropriately. A 1994 study of a nuisance abatement ordinance in San Diego, California revealed that it reduced reported crimes at drug-dealing nuisance addresses by 35%. A 2015 study of a nuisance abatement ordinance in Anchorage, Alaska revealed that it reduced police calls for service by 24%, and another study of a nuisance abatement ordinance in Green Bay, Wisconsin revealed that it reduced police calls for service by 28%.

Evaluating the Lakewood Ordinance

The Lakewood ordinance allowed the city attorney to fine property owners if their properties were declared a public nuisance for either of two reasons. One way an address could be declared a nuisance was through excessive calls for police services, or the commission of felonies on the premises. An address could also be declared a nuisance if it had numerous health and safety code violations, such as uncut grass, excessive trash, broken windows, or abandoned vehicles— regardless of calls for police services. As these two ways of becoming a nuisance have different mechanisms, these two types of nuisances were examined separately.

The first 100 addresses that the City of Lakewood designated as nuisances due to excessive police call activity were examined. These addresses consisted of mostly taverns, apartment buildings, and rental houses. For each of these addresses, we examined the number of police, fire, and EMS calls to the address for a period of 12 months before the property was assessed a nuisance, and 12 months after the nuisance designation was applied.

After nuisance notification was made to the property owners of these 100 Lakewood addresses, 95% of the addresses experienced a decline in police calls for service over the following 12 months. Calls for fire / EMS services also declined at 41% of the addresses. All totaled, crime-related calls at these 100 addresses declined by 77% after being designated a nuisance, and disorder-related calls fell by 61%.

Declaring an address a nuisance for only health code violations without an excessive number of crimes or calls for service was far less common, so the researchers only examined the first 50 addresses where the ordinance was applied for this reason. Despite these 50 addresses having far fewer calls for service to begin with, calls for police services at these locations still fell by 23% after notification. Crime-related calls fell by 56% and disturbance calls fell by 36%. Rates of fire and EMS calls did not change.

Citywide crimes and calls for service were then examined for 7 years before the ordinance was adopted and 7 years after its adoption. After controlling for crime rate and population changes experienced across the Cleveland Metro Area, it was revealed that the period after the ordinance was adopted saw an 8% reduction in calls for police services (about 196 fewer calls per month) that was not explained by metro area crime or population shift trends. Furthermore, the period after the ordinance went into effect saw declines of 9% for aggravated assault, 20% for theft, 27% for burglary, and 57% for auto theft and thefts from autos beyond the metro-wide changes in crime.

Notwithstanding the concerns raised by landlords, the ACLU, and the social work professors from outside of the community, negative social consequences were not revealed in Lakewood. In the first eight years of its existence, the ordinance had been applied to less than 1% of the buildings within the city. In 65% of the properties declared nuisances, the property owners quickly responded to the designation by improving the conditions at the address to the point that the city was satisfied no financial penalties needed to be assessed. The significant reductions in crimes and disturbances also improved the safety and quality of life of those who lived or worked in and around these nuisance addresses.

Analysis of residential properties that had been declared nuisances revealed that, after receiving notification, the landlords at these addresses oftentimes did evict tenants contributing to the crimes and disturbances. However, the behaviors that generally resulted in eviction were serious, such as violent crimes, drug dealing, and prostitution. Persons evicted had lengthy criminal records and no evidence was revealed to suggest that individuals not engaged in crimes, such as innocent victims of domestic violence, were evicted in the 100 addresses examined. In fact, not wanting to repeat the same problems with new tenants, the landlords appeared to replace the younger, problem tenants with new elderly or disabled tenants that were less likely to create trouble, but were more in need of medical care and other public safety assistance. An unintended benefit of the ordinance, therefore, appeared to be that it increased access to affordable safe housing options for the elderly or disabled. As these properties became safer with the eviction of people who engaged in criminal and other antisocial behaviors, these apartments became more hospitable locations for the elderly and disabled to reside.

Conclusion

Three conclusions can be drawn from this information. First, just as the previous research in Alaska, California, and Wisconsin had revealed, the totality of the evidence in Lakewood, Ohio indicated that the ordinance was successful at significantly reducing crime and disorder at specific addresses and citywide. It did so without simply displacing crime and disorder to other parts of the city, as crime and calls went down citywide.

Second, it improved the lives of all the inhabitants of the community, rather than harming them. It improved the quality of life for the residents nearby the nuisance properties, and across the city. It saved the city thousands of tax dollars annually in police services provided at nuisance addresses. It increased safe and affordable housing options for the elderly and disabled to reside within the city.  

Finally, it revealed that municipalities and law enforcement agencies can rely on sound scientific research to select evidence-based solutions to the problems they face and to defend themselves from baseless allegations or accusations based on anecdotes.

More law enforcement agencies should feel confident in standing up for their policies and practices that are evidence-based and rely on scientific research to refute unsubstantiated claims made by persons or groups with a political agenda based on anecdotes rather than evidence-based statistical analysis.   


Pick Your FTOs Carefully

Field Training Officers (FTOs) play a crucial role in preparing new officers for the complexity of the job, and transmitting the police department culture to these new officers. In the police academy, recruits develop a foundational “book knowledge,” but it is the field training portion that teaches them how to fairly and impartially apply all they have learned to real-world situations. FTOs cultivate in new officers a set of values and priorities that the new officers use as a lens through which to view the job, the department, and the community. The FTO teaches the new officer what behaviors and attitudes are accepted by the department – officially or unofficially. Since FTOs play such an important role in the formation and transmission of the agency’s culture, law enforcement agencies should be very careful about who they select as FTOs. Agencies need to devote careful attention to the selection, training, and ongoing supervision of their FTOs.

One might anticipate that those officers selected to become FTOs are among the best patrol officers on the department. One might imagine FTOs display ethical standards, positivity, and performance at a higher rate than their peers. This, however, is not always the case. Criminologist Ivan Sun studied FTOs within two large city police departments. As one would expect, his research revealed that, in general, the FTOs were more proactive than non-FTOs in attempting to locate suspects and witnesses. They were also more likely than their peers to display problem-solving skills when handling calls for service.

FTOs did not differ from non-FTOs, however, in a number of other areas. In level of proactivity for security checks, field interrogations, and traffic stops, FTOs and non-FTOs also were generally very similar. FTOs and non-training officers also were similar in their frequency or severity of use of force, and in their attitudes toward co-workers and members of the public. Of the two police departments Dr. Sun studied, on one department he found that the FTOs were generally more critical of their immediate supervisors and their department’s command staff than were non-training officers. While all officers gripe at times, these FTOs were much more likely than non-training officers to criticize the department.

Consider the impact such a situation would have, as disgruntled officers with insubordinate attitudes are training the next generation of patrol officers. In fact, several researchers, from the 1970s to the 2000s, have documented examples of FTOs directing new officers to “forget everything they learned in the academy” and indoctrinating them in a new set of values not fully supported by management.  

 Two studies illustrate the influence FTOs can have on the generation of officers they train. The first study, conducted by Criminologist Allison Chappell of Old Dominion University, examined an attempt to implement community problem-oriented policing into one city police department. Despite that fact that all of the existing officers received a short training course on community policing, departmental policies changed to reflect this new policing strategy, and new recruits in the academy received extensive community policing training, the department struggled to change its philosophy. Dr. Chappell’s research revealed that one significant hindrance to the acceptance of community problem-oriented policing was the lack of buy-in by the department’s FTOs. These FTOs failed to model community policing behavior and discouraged rookie officers from engaging in community policing activities, communicating “we don’t do that crap.”

The second study was conducted by a criminologist and former law enforcement officer, Ryan Getty of California State University Sacramento. Dr. Getty studied 218 new officers on one large city police department, tracking their performance across their first two years on the job. Despite the fact this police department had a very stringent FTO selection process, Dr. Getty found that not all of the department’s FTOs produced good outcomes. He found that who an officer had as an FTO strongly predicted whether or not that officer would receive citizen complaints during his or her first two years of work experience. If a rookie officer had experience riding with one of a couple of specific FTOs, they had a higher likelihood of receiving a citizen complaint than did rookies who never rode with these specific FTOs.

As all of the officers in field training had to spend time riding along with at least three different FTOs, many officers had exposure to these troublesome FTOs. Still, officers who had never ridden with these troublesome FTOs were less likely to earn citizen complaints when they were cut loose to patrol on their own. Not surprisingly, Dr. Getty found that the more rides a rookie officer had with one of the troublesome FTOs, the greater the odds the rookie would receive citizen complaints.

Unfortunately, Dr. Getty’s study did not delve further to learn exactly what these troublesome FTOs were doing differently. On the department that was studied, the FTO selection and review process was very stringent (thus the reason for the study), and officers could be removed from the FTO assignment if they accumulated a substantiated citizen complaint. As a result, it was unlikely these troublesome FTOs were engaging in significant misconduct. It could have been that the troublesome FTOs were possibly modeling improper attitudes towards departmental policies and/or the community. For example, it’s possible that after dealing with a particularly difficult citizen, and doing so appropriately, the FTO later vented to the rookie officer, “If I had not been wearing a body camera I would have tuned that guy up for talking to me that way.” The FTO may have been simply blowing off steam and may never have engaged in unnecessary force, but such a statement may be interpreted by the impressionable rookie as a cultural value that it is okay to use unnecessary force as long as one can safely get away with it.

The problem might also have been something different. Instead of modeling negative values, the troublesome FTOs might have failed to address the rookies’ negative values. The FTOs might have been timid, burned out, or did not feel empowered (felt the department had their backs), causing them to be reluctant to reign in some troublesome behaviors they might have seen in their trainees. Regardless of the mechanism, these few FTOs contributed to the rough career starts of some rookie officers and some unnecessarily negative police-citizen interactions.

Clearly, the field training process plays an important role in the development of new officers. Therefore it is crucial that only FTOs who will convey the proper work behaviors and attitudes should be assigned to this job. Your agency needs to carefully select FTOs who portray the work behaviors you want to see in all of your officers. Your agency needs to carefully select FTOs who share the values and attitudes you want to see in all of your officers. Your agency needs to carefully train FTOs how to properly teach new officers and remind them that they are constantly being observed and modeled by their rookies. Your agency needs to monitor your FTOs to ensure they are not getting burned out or their attitudes have changed over the years.

Finally, your agency needs to empower your FTOs so that they can be confident that they will be supported when they confront inappropriate rookie behaviors or attitudes, even to the point of terminating the rookie. After all, FTOs are often in the best position to determine if a new officer is, or is not, a salvageable member of the agency. For better or worse, FTOs play a crucial role in determining the future work culture and success of your department.    

About the Author

Matt Dolan is a licensed attorney who specializes in training and advising public safety agencies in matters of legal liability. His training focuses on helping agency leaders create sound policies and procedures as a proactive means of minimizing their exposure to costly liability. A member of a law enforcement family dating back three generations, he serves as both Director and Public Safety Instructor with Dolan Consulting Group.

His training courses include Recruiting and Hiring for Law EnforcementConfronting the Toxic OfficerPerformance Evaluations for Public SafetyMaking Discipline Stick®, and Supervisor Liability for Public Safety.

References

1.  Sun, I. Y. (2002). Police officer attitudes toward peers, supervisors, and citizens: a comparison between field training officers and regular officers. American Journal of Criminal Justice, 27(1), 69-83; Sun, I. Y. (2003). A comparison of police field training officers’ and nontraining officers’ conflict resolution styles: controlling versus supportive strategies. Police Quarterly, 6(1), 22-50; Sun, I. Y. (2003). Officer proactivity: a comparison between police field training officers and non-field training officers. Journal of Criminal Justice, 31(3), 265-277.

2.  Sun (2002); Sun (2003).

3.  Chappell, A. T. (2007). Community policing: Is field training the missing link? Policing: An International Journal of Police Strategies & Management, 30, 498-517; Ford, R. E. (2003). Saying one thing, meaning another: the role of parables in police training, Police Quarterly, 6(1), 84-110; Van Maanen, J. (1973). Observations on the making of policeman. Human Organization, 32, 407-418; Van Maanen, J. (1974). Working the street: A developmental view of police behavior. In H. Jacob (Ed.), The Potential for Reform of Criminal Justice (pp. 90-92). Beverly Hills, CA: SAGE.

4.  Chappell (2007).

5.  Getty, R., Worrall, J. L., & Morris, R. G. (2016). How far from the tree does the apple fall? Field training officers, their trainees, and allegations of misconduct. Crime and Delinquency, 62(6), 821-839.  

6. Getty et al. (2016).

What is Your Real Hiring Pool?

Law enforcement agencies are often confronted about the racial makeup of their departments by members of the news media, civil rights activists, community groups, or local politicians. Often those who are criticizing police agencies compare the racial composition of the police department’s employees to the racial composition of the city or county that they police. When racial minority group members make up a larger percentage of the total community population that is represented on the police department, racial discrimination in hiring practices is often alleged.

However, making a simple comparison to U.S. Census statistics is severely flawed because (1) the hiring pool of eligible applicants does not stop at the city limits, and (2) not everyone within the city limits is eligible to apply to be a law enforcement officer. The Census data, for example, include children and senior citizens who are ineligible to be police officers. It also includes people who lack a high school education, individuals who cannot speak English fluently and persons who are not U.S. citizens. Furthermore, Census data includes persons who are not in the labor force due to profound disabilities or because of institutionalization in prisons, jails, or medical or psychiatric facilities.

A more sophisticated analysis of a jurisdiction’s Census data often reveals a very different picture of the racial demographics of those men and women who are actually eligible to serve as law enforcement officers. Census data already include information regarding the citizenship, English proficiency, education level, employability, veteran status, and age of the individuals surveyed. Even without the ability to exclude individuals from the Census data due to background issues such as a prior criminal history or illegal drug use, simply excluding individuals who are not U.S. citizens, lack basic English proficiency, lack the minimum education level, are institutionalized, or are too young or old to apply for a law enforcement job, can reveal striking changes in the racial composition of who is eligible to even apply for a law enforcement job.

In a 2015 article, the New York Times compared the racial demographics of several city law enforcement agencies with the basic Census demographics of those cities to reveal which had the greatest racial disparities. The article implied that these city police departments were, at the least, insensitive to the communities they policed and, at the worst, engaged in discriminatory hiring practices to prevent minority candidates from being hired. Moreover, their analyses neglected to consider that police officer recruitment often casts a wide net and potential candidates will reside not only within the city limits but also in the greater metropolitan area. These conclusions based on a cursory look at Census data is all too common and fails to take into account the discoverable factors that could account for what may appear to be inexplicable racial disparities in law enforcement agencies.

The material to follow will examine the statistical evidence of two major cities with large racial disparities in hiring—Baltimore and Houston—using a more common sense approach that actually analyzes the Census data.

Baltimore

As of 2016, Baltimore, Maryland had a population of 614,664 inhabitants, of which 63% were African-American. The police department is only 44% African-American. In other words, African-Americans are under-represented on the Baltimore police force by 19 percentage points, and Whites are over-represented on the force by 20 percentage points. This calculation, however, does not take into account the actual hiring pool for the Baltimore Police Department, which is comprised of those who meet the minimum requirements to even apply to become an officer.

According to the Baltimore Police Department’s website, applicants for the position of police officer must be (among other things) a U.S. citizen, be able to speak, read, and write in English, at least 20 years and 9 months old, possess a high school diploma or GED, pass a physical agility test, pass a medical screening, and pass a mental health screening. Although the department has no established maximum age limit, it is assumed no one age 65 or older (the U.S. Social Security age for retirement) would be applying to begin a career with this department. Table 1 below displays the racial composition of all 2016 inhabitants of Baltimore, and the racial composition of the Baltimore Police Department. It then displays the racial demographics of the Baltimore inhabitants in the metropolitan area (approximately a 30-mile radius from the city center) who meet the most basic requirements to apply to become Baltimore officers. These are people who are at least age 21 and less than age 65, have at least a high school diploma or GED, are U.S. citizens (including naturalized citizens), and speak English “well,” “very well,” or fluently. Individuals who reported they were not in the labor force (such as due to a disability, stay-at-home parenting, early retirement, or institutionalization) were also excluded.


Table 1. Baltimore, Maryland Estimates (2016)
 

Total City Census Population

Baltimore P.D. Sworn Personnel

Eligible Census Metro Population

Number

614,664

2,952

1,126,246

African-American

(non-Hispanic)

63.0%

44.0%

27.7%

White (non-Hispanic)

27.7%

48.0%

62.0%

Hispanic

4.8%

7.0%

3.5%

All Other Racial Groups

4.5%

1.0%

6.7%

Note: Census data estimates for metropolitan areas have a margin of error of approximately ± 1.9 percentage points    


When examining the data for the metro area (again, a 30-mile radius from the city center), only 41% of the individuals in the Census data for the metro are met these basic eligibility criteria. Table 1 reveals that even though 63% of the inhabitants of the city may be African-Americans, only 27.7% of those who met the minimum requirements to apply to be a police officer in the metropolitan area are African-Americans. This reveals that rather than being under-represented on the Baltimore police force by 19 percentage points, African-Americans are actually over-represented by over 15%. Regarding Whites, instead of being over-represented by 20 percentage points, they are actually under-represented by 14% in the pool of eligible candidates. Furthermore, Hispanics are employed by Baltimore at a rate twice as high as the proportion of Hispanics that make up those eligible to apply. In other words, when one considers those who are actually eligible to apply to be police officers in the Baltimore metropolitan area, the Baltimore Police Department appears to have done an admirable job of creating a police force that represents the racial proportions of their city.

Houston

Similar issues exist in Houston, Texas where, when compared to the total Census for the city, African-Americans are equally represented, but Hispanics are under-represented by 22 percentage points and Whites are over-represented on the police force by 27 percentage points. Once again it is important to consider who among the city’s inhabitants are actually eligible to even apply for the position of law enforcement officer. Among other things, the minimum requirements for application to the Houston Police Department include a high school education and either two years of college, or prior military service, or prior service as a law enforcement officer. Houston also requires applicants to be U.S. citizens, be able to read and write in English and be at least 20 years and six months old and no older than 44 years old. How do these basic requirements change the landscape of who in Houston is eligible to apply to be a police officer? Table 2 below reveals the results.

In order to determine the demographics of those eligible to apply to the Houston Police Department, the metro area Census data (30 mile radius from the city center) was filtered to find only the individuals who were between ages 21 and 44, were citizens, spoke English, and were either veterans or had at least 2 years of college. Persons who were not in the labor force (due to early retirement, stay-at-home parent, disability, or institutionalization) were also excluded. After filtering the Census data, only 9.9% of the individuals in the metro area met the basic requirements to apply to be a Houston police officer.


Table 2. Houston, Texas Estimates (2016)
 

Total City Census Population

Houston P.D. Sworn Personnel

Eligible Census Metro Population

Number

2,303,482

5,295

662,094

African-American

22.8%

22.0%

19.5%

White (non-Hispanic)

25.1%

52.0%

50.4%

Hispanic

44.3%

22.0%

18.0%

All Other Racial Groups

7.8%

4.0%

12.1%

Note: Census data estimates for metropolitan areas have a margin of error of approximately ± 1.9 percentage points    


Table 2 reveals that when comparing those that met these basic application requirements with those actually employed by the Houston P.D., Hispanics were slightly over-represented on the police force by 4 percentage points, while African-Americans and Whites were relatively on par, and all other racial groups (primarily Asians) are under-represented by 8 percentage points. Again, rather than being vilified by the press and civil rights activists, Houston should be lauded for the racial diversity it has attained in the face of fewer qualified inhabitants.

Other Considerations

While these basic estimates reveal significant racial demographic differences between the total population of a community and those who meet some basic age, educational, and employability criteria, such analyses still do not account for a host of other legitimate screening criteria. Law enforcement recruits should be free of background issues such as a criminal record or poor driving record. A number of criminological studies have indicated that, compared to other racial groups, African-Americans are over-represented among those arrested and convicted of violent crimes—increasing the proportion of African-Americans ineligible to serve as law enforcement officers. One study found that, compared to drivers of other racial groups, African-American drivers were significantly more likely to have a suspended or revoked driver’s license or be driving without ever having obtained a license.   

Might there also be racial and ethnic differences in the proportions of individuals willing to pursue employment in law enforcement based on education and professional opportunities in the private sector? The Bureau of Labor Statistics reports reveals that as of 2016, 52% of Asian-American adults held employment in professional careers such as doctors, nurses, lawyers, accountants, engineers, scientists, university professors, and business executives. Only 40% of Whites, 30% of African-Americans, and 22% of Hispanics hold such careers. While only 12% of the U.S. population holds an advanced graduate degree, more than 20% of Asian-Americans hold such a degree. Is it realistic to expect large numbers of Asian-Americans to give up high-paying careers, for which they spent many years in college to earn, to take jobs as law enforcement officers with middle-class pay, shift work, and higher risks for danger?

Migration patterns also can have an influence. The racial or ethnic demographic composition can sometimes change very rapidly. For example, the police in Ferguson, Missouri were derided in the media because the department lacked many African-American officers. In 1990, the city population was only 25% African-American—one-quarter of the community. In 2000, African-Americans had grown to 52% of the community, and by 2010, the city population grew to 67% African-American. Ferguson is a small city of nearly 21,000 inhabitants and a police force of only about 45 officers. It would be unconstitutional and illegal to fire White officers, hired when the city was mostly White, once the city became majority African-American. While such a police force should take steps to increase the racial diversity of its new hires as the diversity of the city grows, 20-30 year careers prevent this transition from happening as fast as demographic shifts in the community. It would be equally inappropriate to begin laying off African-American officers in cities that become gentrified and see growths in White populations.   

In 2015, while speaking at the annual conference of the International Association of Chiefs of Police, President Barack Obama stated, “Too often, law enforcement gets scapegoated for the broader failures of our society and criminal justice system.” Law enforcement agencies should not be defamed or slandered for the societal circumstances that result in racial and ethnic differences in citizenship, education, age distribution, health, and career preferences.  

Why You Need an Analysis

When challenged by local politicians, concerned citizens, activist groups, or the media, municipal and law enforcement leaders will need their own analysis to provide responses and develop strategies that are based upon available data. Dolan Consulting Group is available to explore the demographic composition of those who meet the most minimum of standards required for application to your agency. If you’re interested in conducting a hiring pool analysis, then contact us to set up an appointment today.

info@dolanconsultinggroup.com


References

1).  Ashkenas, J., & Park, H. (2015). The race gap in America’s police departments. New York Times, April 8, 2015. Retrieved from: https://www.nytimes.com/interactive/2014/09/03/us/the-race-gap-in-americas-police-departments.html 

2). U.S. Census Bureau Data (2016)

3). Ashkenas & Park (2015)

4).  U.S. Census Bureau Data (2016)

5). Ibid.

6). Ashkenas & Park (2015)

7). U.S. Census Bureau Data (2016)

8). Felson, R. B., Deane, G., & Armstrong, D. P. (2008). Do theories of crime or violence explain race differences in delinquency? Social Science Research, 37, 624-641; Felson, R. B., & Kreager, D. A. (2015). Group differences in delinquency: What is there to explain? Race and Justice, 5(1), 58-87; Walker, S., Spohn, C., & Delone, M. (2011). The Color of Justice: Race, Ethnicity, and Crime in America. New York, NY: Wadsworth.

9).  Regoeczi, W., & Kent, S. (2014). Race, poverty, and the traffic ticket cycle: Exploring the situational context of the application of police discretion. Policing: An International Journal of Police Strategies and Management, 37(1), 190-205.

10).  U.S. Department of Labor (2017). Retrieved from: https://www.bls.gov/opub/reports/race-and-ethnicity/2016/home.htm 

11).  Ryan, C. L., & Bauman, K. (2016). Educational attainment in the United States: 2015. Retrieved from: https://www.census.gov/content/dam/Census/library/publications/2016/demo/p20-578.pdf 

12). Korte, G. (2015). Police officers too often ‘scapegoated’ for problems in society, Obama says. USA Today, October 27, 2015. Retrieved from: https://www.usatoday.com/story/news/politics/2015/10/27/police-officers-too-often-scapegoated-problems-society-obama-says/74662192/

The Public’s Confidence in the Police Might Be Better Than You Think

We frequently see stories in the national news media about the public’s lack of trust in the police. When these stories move beyond anecdotal accounts, they often cite Gallup Poll data regarding public confidence in the police. For instance, much media attention was paid to the fact that public confidence in the police dipped to about 50% at the time of the unrest in Ferguson, Missouri in late 2014.

To be sure, a public confidence rate in which one out of every two Americans lacks confidence in the police is nothing to celebrate within our profession. Obviously, we wish for a higher confidence rate, like law enforcement had during the late 1960s when 7 out of 10 Americans had confidence in the police. But how does public confidence in law enforcement stack up against public confidence in other institutions, especially in recent years?

Graph 1 below shows the trend in Gallup Poll data on public confidence in the police from 1990 through the first half of 2018. This is a graph of the percentage of Americans surveyed by the Gallup Organization who indicated that they had “a great deal” or “quite a lot” of confidence in their local police, year by year. As one can see, since 1990, confidence in the police has fluctuated back and forth from about 50% to about 65%. When a sensational case of police use of force or corruption gets widespread national media attention, such as the Rodney King Incident (1991), the Rampart Scandal (1997), or the Ferguson Shooting (2014), public confidence in the police declines to near 50%. When national media attention lauds the police as heroes, such as in the aftermath of the 9/11 Attacks, or the mass assassinations of police officers during 2016, public confidence rises above 60%. Nevertheless, for the last 28 years, public confidence in the police bounced back and forth, but never fell below 50%, or rose above 65%.  

Graph 1. Gallup Poll Data on Public Confidence in the Police (1990-2018)

While we would all like to see these numbers go higher, Americans have an inherent mistrust of all government institutions. Numerous surveys that have compared American attitudes with those of other Western democracies, such as Great Britain, France, Germany, Spain, and Japan, consistently reveal that Americans have the greatest cynicism towards government. Americans have historically wanted a minimum of government interference in their lives and tend to be suspicious of government.

So how does public confidence in law enforcement stack up against public confidence in other government institutions? Law enforcement in the U.S. is overwhelmingly a local government function, with 90% of law enforcement officers employed at the municipal or county level. The only other local government institution that the Gallup Poll has consistently included within its public confidence surveys has been public education. So how does public confidence in law enforcement compare to public confidence in public education since 1990?

Graph 2 compared the trend in public confidence in the police, with public confidence in public education, from 1990 through the first half of 2018. As this graph reveals, public confidence in public education has been below 50% since before 1990. Like law enforcement, public confidence in public education was in the 70% range during the late 1960s, but began to decline after 1973, and by 1990 had dropped below 50%.

Graph 2. Gallup Poll Data on Public Confidence in Police and Public Education (1990-2018)

While the national news media has remained relatively silent on these poll results, public confidence in public education has averaged 15 to 20 percentage points lower than that of public confidence in the police. This gap has also widened over time to the point where, for the first half of 2018, public confidence in public education is 36 percentage points lower than public confidence in the police. While public confidence in the police over the last 28 years has fluctuated between two points (50% and 65%), public confidence in public education has been much lower and continues a slow decline.

What about other government institutions? Graph 3 below reveals the levels of public confidence in the police alongside the levels of public confidence in Congress, the President, and the Supreme Court. As this graph reveals, since 1990, public confidence in law enforcement has remained much higher than the level of public confidence in the three pillars of the federal government. Even at its worst, public confidence in the police has been 12 percentage points higher than public confidence in the Supreme Court or the President at their best. The highest public confidence score Congress has received since 1990 is still 35 percentage points lower than the lowest public confidence score recorded for the police. Depending on the candidates they would like to bolster or tear down, the national news media outlets devote some attention to these federal government public confidence scores, but never in comparison to how much higher public confidence is in the police.

Graph 3. Gallup Poll Public Confidence in Police and Federal Government (1990-2018)

Undoubtedly the law enforcement professionals should continue to work hard to improve the public image of the police. Nevertheless, compared to other government institutions at the local and national level, it appears that the law enforcement profession is doing pretty well in terms of public confidence.

So why would the media focus so much attention on the “low” level of public confidence in the police? Might it be an effort to create a sensational story as a way to increase viewer ratings? This is likely, as there are a number of former mainstream media journalists who claim this sort of business strategy is used routinely. Television news and newspaper editors are constantly pressuring their field reporters to find the next “big scoop,” or to sensationalize boring, mundane stories. Law enforcement has clearly received more than its fair share of this sensationalizing over the last few years.

Regardless of the cause of the media’s focus on the perceived lack of confidence in the police, there is an irony in this focus—the level of confidence in the media itself is dismally low among the American people. Our final graph, Graph 4, compares the Gallup Poll data on public confidence in the police, with Gallup Poll data on public confidence in the television news media. In 1990 and 1991, law enforcement and the television news media had similar levels of public confidence – between 55% and 60%. After that, public confidence in the television news media took a major nose dive, dropping far below public confidence in the police, even in the midst of the Rodney King trial and riots that hurt law enforcement’s public image. Public confidence in television news media fell from 58% in 1990, to 33% in 1995. After its initial plummet in the early 1990s, public confidence in the television news media has never recovered.

Graph 4. Gallup Poll Public Confidence in Police and Television News (1990-2018)     

After 1995, public confidence in television news has slowly declined further. Over the last 10 years, public confidence in the television news media has fluctuated between 20 and 28% – about 22 to 30 percentage points lower than the lowest recorded level of public confidence in the police. According to the Pew Research Institute, since 1990, newspaper readership (including online editions of newspapers) has been cut in half, declining by 51%. Network television news viewership has also declined by 43% since 1990.

In summary, public confidence in the police has remained fairly stable over the last 28 years, fluctuating between 50 and 65% from year to year. Nevertheless, confidence in the police has remained much higher than public confidence in other institutions with the isolated exceptions of the military and small business. Finally, for almost three decades, public confidence in the television news media (the prominent voice in public discourse decrying lack of public trust in the police) has been falling and is actually substantially lower than the level of public confidence in law enforcement.

These statistics demonstrate something fundamentally important: law enforcement officers are members of one of the most trusted institutions in our country—more than our news media, our public schools or our elected political bodies. There is a clear majority of the public that supports you and trusts in your work. That confidence is something to be protected through the professional execution of your duties as officers.


References

1 See, for example: https://www.washingtontimes.com/news/2014/aug/26/public-trust-police- low-poll-finds/ 2 Johnson, R. R. (2016). Why Officer Demeanor Matters. Raleigh, NC: Dolan Consulting Group. 3 Mauk, D., & Oakland, J. (2008). American Civilization: An Introduction. New York, Routledge. 4 Reaves, B. A. (2011). Census of State and Local Law Enforcement Agencies, 2008. Washington, DC: Bureau of Justice Statistics. 5 Attkisson, S. (2014). Stonewalled. New York, NY: Harper; Boynton, R. S. (2005). The New New Journalism: Conversations with America’s Best Nonfiction Writers on Their Craft. New York, NY: Vintage; Hersh, S. M. (2018). Reporter: A Memoir. New York, NY: Knopf. 6 Clarke, D. A., & Hannity, S. (2017). Cop Under Fire: Moving Beyond Hashtags of Race, Crime and Politics for a Better America. New York, NY: Worthy Publishing; Mac Donald, H. (2016). The War on Cops: How the New Attack on Law and Order Makes Everyone Less Safe. New York, NY: Encounter Books. 7 Pew Research Institute (2018): http://www.journalism.org/fact-sheet/newspapers/ 8 Engel, P. (2014, January 10). Most Americans don’t recognize America’s top evening news anchor. Business Insider. Downloaded at: https://www.businessinsider.com.au/most-americans- dont-recognize-americas-top-evening-news-anchor-2014-1